The two decline numbers, and the one that gets misquoted
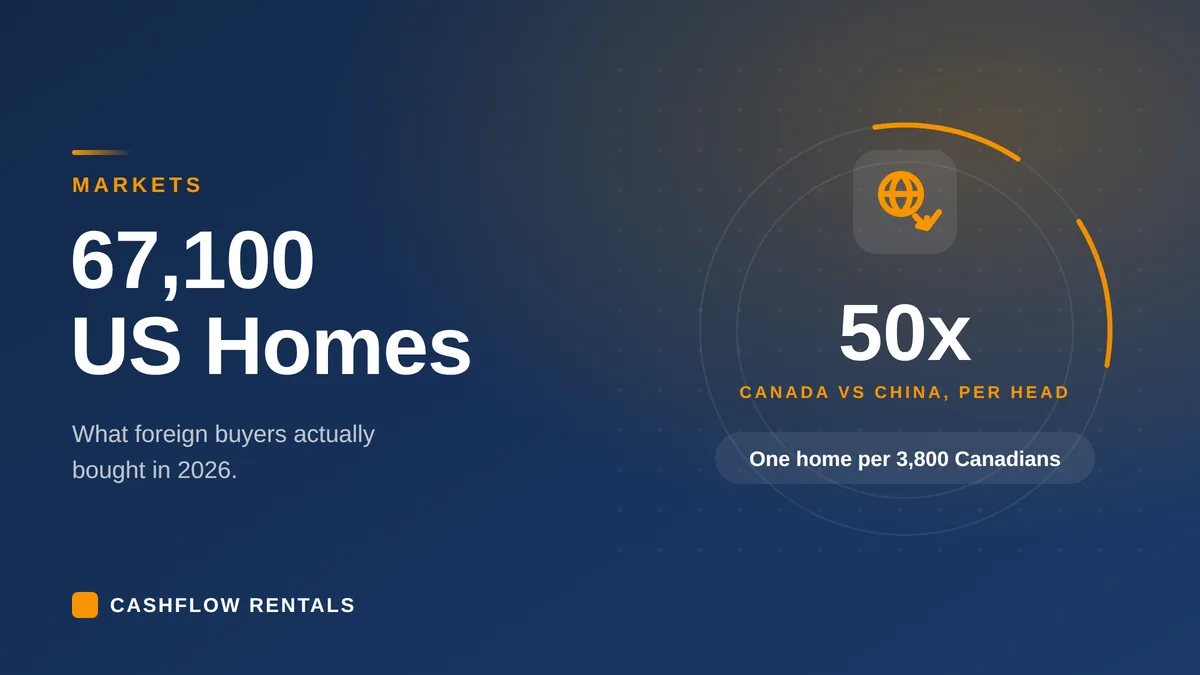
Here's what you need to know. The number of homes foreign buyers purchased fell 14%, from 78,100 to 67,100. The dollar volume fell 19.1%, from $56 billion to $45.3 billion.
If you see a headline this week saying foreign purchases of US homes fell 19%, that's the money, not the houses. It matters because the gap between those two figures is itself worth understanding, because it tells us something important. Dollars fell faster than units, so foreigners are buying less expensive properties. Work through the numbers (thank you AI) and you'll see that the average price paid went from about $717,000 last year to about $675,000 this year.
So foreign buyers didn't just buy fewer homes. The ones who did buy spent less per home. That's a different market from the one we saw twelve months ago, when NAR reported a record median price and the first year over year increase in purchases since 2017.
I'll come back to this later, because it's one piece of the puzzle that supports my own lived experience dealing with overseas investors buying US rental properties.
Foreign buyers are 1.7% of the US market
This is the number I'd put in front of anyone nervous about competing with international money, and it almost never makes the news.
Foreign buyers were 1.7% of all US home sales by count and 2.0% by dollar volume. A year earlier those figures were 1.9% and 2.5%. So on pure unit volume, there really wasn't much change in market share.
Two things follow. First, the "foreigners are buying up America" story is hokum. Ninety eight out of every hundred US homes sold went to somebody who wasn't a foreign buyer. Second, and likely more useful to you, the dollar share fell harder than the unit share. Foreign buyers didn't just take a smaller slice, they gave up ground fastest at the expensive end. That tells me they're pulling back from big, expensive luxury homes. Typically, those are the second homes and vacation properties.
One thing I can tell you from doing this myself since 2016: I've never once lost a property because an overseas buyer outbid my client. I've lost plenty to local owner occupiers and to local investors. In a market of roughly four million annual sales, us foreigners are pretty much insignificant.
Canada is top now, and not because Canadians bought more
Canadian buyers made up 16% of all foreign purchases this past year, up from 14% the year before. That puts America's favorite neighbor firmly at the head of the pack by number of homes purchased.
China, last year's leader, dropped to third at 11%. Canadians are my largest client group, so this is the figure I was watching for most closely, and it's worth being precise about what Canadian buyers actually did this year.
So the narrative that Canadians are pulling out is patently wrong. Canadian buyers accounted for about 10,700 homes this year against roughly 10,900 last year. So while overall foreign purchases fell by 14%, Canadian purchases barely moved. There's more to the Canadian side of this than the ranking, including why they spent $1 billion less while buying the same number of homes, which I've dug into in the full Canadian breakdown.
China went from about 11,700 homes and $13.7 billion to 7,400 homes and $7.6 billion. Roughly a third fewer homes, and close to half the money. Chinese buyers bought less, and what they did buy was cheaper than the year before.
What buyers from each country actually paid
NAR gives the share, the number of homes, and the dollar volume for the top five countries. It doesn't give you the average price per buyer, so I've worked it out from NAR's own figures.
Top five countries by number of US homes bought, with average price per buyer| Country | Share of foreign purchases | Homes bought | Dollar volume | Average per buyer |
|---|
| Canada | 16% | 10,700 | $5.2 billion | About $486,000 |
| Mexico | 14% | 9,400 | $5.0 billion | About $532,000 |
| China | 11% | 7,400 | $7.6 billion | About $1,027,000 |
| India | 9% | 6,000 | $3.7 billion | About $617,000 |
| United Kingdom | 4% | 2,700 | $1.2 billion | About $444,000 |
Averages calculated from NAR's published home counts and dollar volumes, July 2026. NAR rounds country shares to whole percentages, so treat these as close approximations rather than exact figures.
When a Chinese buyer is spending more than twice what a British buyer spends, these are completely different transactions, in different states, for different reasons, and rolling them into one "foreign buyer" statistic is too high level to really understand what's happening.
Per head of population, Canada buys about 50 times more than China
Here's some nuance to this data that the nerd in me was really curious about.
Canada bought 10,700 US homes. China bought 7,400. Side by side those look like broadly similar numbers from two broadly comparable sources of demand. Except there are about 40.5 million Canadians, and about 1.41 billion people in China.
Run it per head of population and the gap stops being a gap.
US home purchases per head of population, top five countries| Country | Homes bought | Population, mid 2026 | Purchases per million people | One purchase per |
|---|
| Canada | 10,700 | 40.5 million | 264 | 3,800 people |
| Mexico | 9,400 | 133.0 million | 71 | 14,100 people |
| United Kingdom | 2,700 | 69.9 million | 39 | 25,900 people |
| China | 7,400 | 1,412.9 million | 5.2 | 191,000 people |
| India | 6,000 | 1,476.6 million | 4.1 | 246,000 people |
Purchase counts from NAR, July 2026. Population figures are UN World Population Prospects 2024 medium variant projections for mid 2026, used for all five countries so the comparison stays on one consistent basis. Statistics Canada's own April 2026 estimate is higher at 41.4 million, which moves Canada to 258 per million and doesn't change the conclusion.
So that's one US home purchase for roughly every 3,800 Canadians, against one for roughly every 191,000 people in China. Canada is running at about 50 times China's rate per head.
Worth noting too that Canada's population is currently shrinking slightly, a third consecutive quarterly decline as of April 2026, so that rate is drifting upward from both directions at once.
And look at India. Fourth by number of homes, and the least active of the five per capita, at about one purchase per quarter of a million people.
Why the spread is this wide comes down to three fairly boring things, and none of them are about enthusiasm for US property.
Proximity. Canada and Mexico share a border with the US, and the top two per capita are Canada and Mexico. Snowbird second homes, family on the other side, cross-border work. For a Canadian, buying in America is a normal thing that normal people do. It isn't an exotic international transaction.
Capital controls. China caps individuals at the equivalent of $50,000 a year in foreign exchange, which makes a $1 million US purchase structurally awkward before anybody even looks at a property. That's also why the Chinese buyers who do come through are wealthy enough to move money by other routes, which is exactly what that $1 million average purchase price is telling you.
Total population is a crude denominator. The real pool isn't everybody, it's households with the means, the mobility, and the legal ability to buy abroad. That pool is a far larger share of Canada than of China or India, so per-capita figures like these flatter richer countries.
This broadly matches with what I see from my own desk, for what it's worth. Canadians are my largest client group by a distance, and it isn't close. Volume tells you where the money is. Per capita tells you where the habit is.
Where the money went, and what fell off the list
Florida took 20% of foreign buyers, California 19%, and Texas 12%. Over half of all foreign purchases went into three states, two of which are among the most expensive in the country. None of them are the markets where rental yields are usually strongest.
The churn at the bottom of that list is more interesting than the top. New Jersey and Georgia came in at 4% each. Last year's fourth and fifth were New York at 7% and Arizona at 5%, and both dropped out. New York doesn't surprise me. Recent political changes there have made it entirely uninvestable in my opinion.
Arizona falling off is worth a pause. It's a snowbird state, and its foreign buyer market leans heavily toward second homes and winter escapes rather than rentals. When a state like that drops out of the top five in the same year NAR's chief economist attributes the decline to falling visitor numbers, that's consistent with my take that lifestyle money is stepping back rather than investment money stepping back.
The median foreign buyer paid $465,000. The median across all US buyers was $413,600. So foreign buyers are still paying roughly a 12% premium to the market as a whole, though that premium narrowed, because the foreign median fell 5.9% from last year's record $494,400. Nearly half of them, 48%, paid all cash, against 28% of US buyers generally.
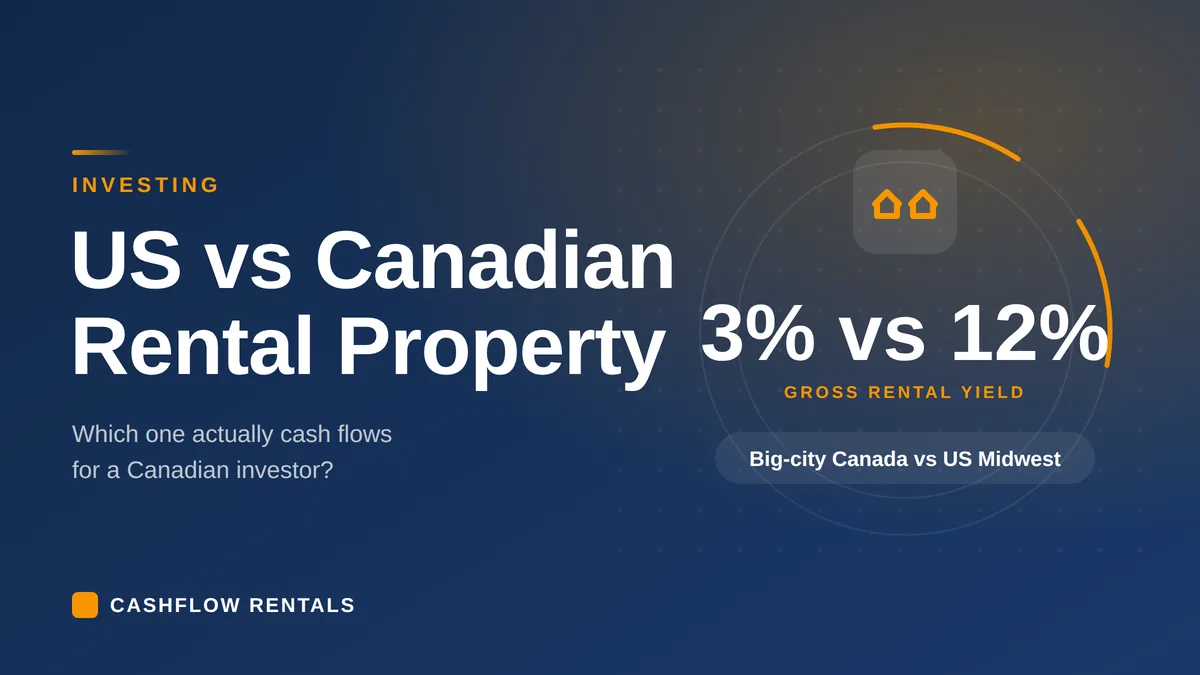
Now hold that $465,000 next to what a decent rental property that actually cash flows costs. In Kansas City, a fully renovated three bed, two bath family home in a decent neighborhood trades in the $175,000 to $220,000 range. You could buy two of them, in cash, for less than the median purchase in this report and have change left over. That's roughly the arithmetic one of my clients, Ronald, who lives in Ottawa, ran when he bought his two Kansas City rentals.
The typical buyer in this report is buying a nearly half million dollar property in Florida or California, often with cash, often for reasons that have nothing at all to do with yield. Their market going quiet tells you very little about the market for a $200,000 Midwest rental of the type my clients and I are buying aggressively.
In my own book of business, every client purchase I've been involved in this year has been in the Midwest. Not one in Florida, California, or Texas, which between them account for over half of everything in this release.
What the free data doesn't tell you
So far I've been fairly confident about all this, so let me be straight about where the data runs out.
NAR's chief economist links the decline to the fall in international visitors and tourists to the US, and the official travel numbers back that up. Overseas visitation was down 4.8% year to date through May 2026 according to the National Travel and Tourism Office. That's a reasonable correlation with lifestyle demand softening. Fewer people visiting means fewer people falling for a place and buying there. It also might say something about the overall opinion of the US amongst the international community, which, let's be honest, could do with improvement.
Another thing I found interesting was the split between foreign buyers living in the US and those living abroad. It didn't move at all. It was 56% resident and 44% non-resident this year, exactly as it was last year, and purchases in both groups fell by the same 14%. If lifestyle buyers had collapsed while investors surged, I'd expect that mix to have shifted. It didn't. So, maybe I'm wrong. I think I'm right, but I'm always happy to learn.
Note: what this report can't tell you. NAR's public release and the free fast facts sheet give the totals, the countries, the states, the cash share, and the median price. They don't break out purpose of purchase, so there's no public figure this year showing how many of those 67,100 homes were vacation homes, primary residences, or rentals. That breakdown sits inside the paid report. So if you see anyone this week claiming confidently that foreign investors specifically are buying more, or less, ask them where the number came from.
What can I offer instead? Only what I see from my own desk in my day-to-day business, and it's an observation, not hard evidence. My closings have carried on through 2026, and inquiries from Canada, Germany, Asia, and Colombia have been growing rather than shrinking. But that's just a mere handful of transactions inside a market of 67,100 overall purchases.
What I'd say with more confidence is this. The money that left this market was expensive money, buying expensive property, in expensive states. Whatever the purpose data eventually shows, the retreat happened at the top end, and the top end was never where rental yield lived.
What I'd take from this if you're buying for cash flow
Four things, and none of them are dramatic.
A softer national number isn't a signal about your deal. Every property still stands or falls on its own neighborhood, its own condition, and its own rent. National foreign buyer volume doesn't appear anywhere in that calculation. It's context, not a green light.
Less competition at the top end doesn't reach down to $200,000 rentals. Whatever slack has opened up in the Florida and California second home market isn't showing up in Midwest rental stock, where you're bidding against local owner occupiers and local investors.
Cash is doing most of the work here, and that's worth examining. Nearly half of these buyers paid cash. Some of that is preference, and some of it is people who assumed they couldn't get a US mortgage as a foreign national. Usually they can, through a lender that underwrites the property's rent rather than your income. I've used that kind of financing for well over a hundred of my own purchases since 2016. Just don't assume the biggest loan is the best one, because a higher LTV at a worse rate can cost you more in total, and over-borrowing is how I got myself into trouble with my earlier portfolio.
The exchange rate isn't the trigger you'd think. NAR notes that a slightly weaker dollar over the past year, which should have handed foreign buyers more purchasing power, didn't produce more activity. Currency moves the margin. It doesn't decide whether a deal works. And it doesn't alter someone's opinion of a country.
If you want to see what actually goes wrong when foreigners buy in the US, I've written about that at length, including the part of my own story I'm least proud of.
Remember, investing isn't about certainties, it's a game of probabilities. A report like this is interesting headline data. It doesn't help you find a good deal. What genuinely improves your odds is the boring stuff: the right property, in the right neighborhood, with the right financing in place, held long enough for the numbers to do their work.
If you'd like the process laid out step by step, it's all in my foreign investor starter kit, including the full purchase checklist I use with clients.
This article is general information, not legal, tax, or investment advice. Cashflow Rentals is not an investment adviser and makes no earnings or return guarantees. Property investment carries risk, including the risk of loss. All figures cited are as reported in July 2026 and cover the 12 months to March 2026. Speak to a qualified cross border tax professional and your own advisers before making any investment decision.