Ohio Rental Property Neighborhoods, Graded: Six Real Reports, Six Cities
This page is the data behind my Ohio hub. It holds every Ohio neighborhood I've graded for a rental property, city by city, with the score, the eleven-segment scorecard, the figures the score rests on, and what I'd check before buying there. Six neighborhoods so far, one in each of Cleveland, Akron, Toledo, Columbus, Dayton and Cincinnati, all six from full technical reports run in October and November 2026. Where a report still has a ruling open, the block says so. I'll add neighborhoods as I grade them, and I'll regrade these when the data moves. If you want the method, it's in how I analyze a neighborhood for rental property. If you want the state, the metros and the deals priced two ways, that's the Ohio hub. This page is the register.

Key takeaways
- Six Ohio neighborhoods graded, six cities. Three are Phase 2: Old Brooklyn in Cleveland (62 of 100), Mid East in Columbus (60) and Norwood in Cincinnati (55). One sits on the line: South Akron (51, three points over, with its eviction count pending). Two are Phase 1: Bancroft Hills in Toledo (49) and Burkhardt in Dayton (43).
- The best neighborhood on this page is not where the best deal is. Mid East scores 60 and the house I priced there loses money at its asking price. Norwood scores 55, with the strongest sales market, schools and eviction figures of the six, and its duplex loses money at the rents in place.
- Four of the six grades lean on city-wide crime data, because Columbus, Dayton, Akron and Norwood publish no address-level incidents. Each is marked data-limited, and each block says what a street-level check could do to the grade. Only Cleveland and Toledo are graded on the quarter mile.
- Evictions decide two grades. Columbus's tract files at 2.2 times the county rate on paper, and 83% of those filings come from one apartment complex, so the house's streets grade at about half the county rate. Akron's count is still pending, and the likely result moves South Akron from Phase 2 to Phase 1. Old Brooklyn files at a quarter of Cleveland's rate while the city's filings rise.
- Every figure here is tract, quarter-mile or ZIP level. None of it is a city average, because a city average has never told me which street to buy on.
How are these grades built, and what does "data-limited" mean?
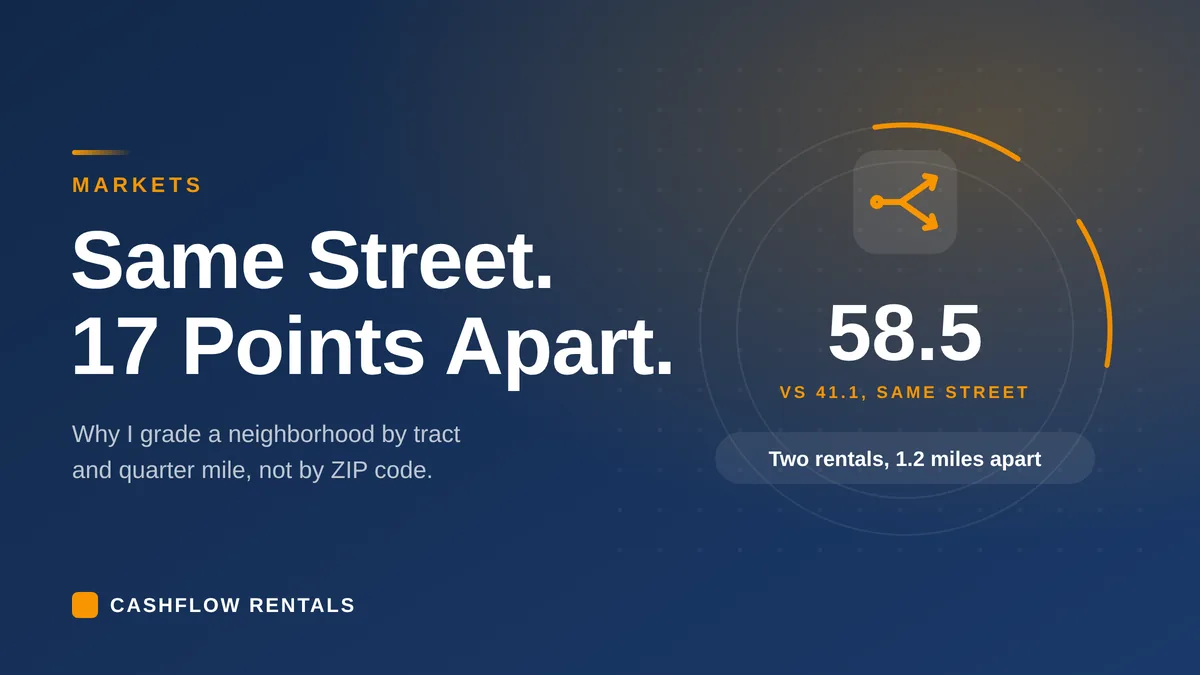
Every neighborhood gets the same eleven segments, each weighted, each graded on a level from 1 to 5 and a trend of up, flat or down. Level plus trend, times the weight, summed, divided by the 552 points available, is the score. Below 50 is Phase 1, cheap and not improving. 50 to 69 is Phase 2, affordable and improving, which is where I buy. 70 and over is Phase 3, established and priced to match. The weights, the rules and three worked Kansas City reports are in the method article linked above, so I won't repeat them here. The reason I grade at tract and quarter-mile level rather than ZIP is two houses on one Kansas City street that scored 17 points apart.
| Segment | Weight | What it's graded on |
|---|---|---|
| Crime and safety | 15 | The crime trend within a quarter mile of the house, against the city. Where a city publishes no address-level data, the city's FBI counts, marked data-limited |
| Rents and rent trend | 12 | Census median rent, live asking rents by bedroom, HUD small-area rents, and the real change since 2019 |
| Sales market | 12 | ZIP median price, sales volume, days on market and sale-to-list |
| Demographics and income | 10 | Tract income against the city, the real change since 2019 and whether it's statistically significant, poverty |
| Employment | 8 | Jobs within 5 miles (10 miles if downtown is more than 5 miles away), 2013 to 2023, from Census LEHD |
| Schools | 8 | Assigned schools' ratings and direction |
| Housing stock and vacancy | 8 | Vacancy against the city, age of stock, building types |
| Owner-occupancy and stability | 6 | 2020 Census owner share against the city, how long people stay |
| Voucher tenancy | 5 | Share of renters on a voucher, voucher rent growth, tenure, from HUD |
| Eviction climate | 5 | Tract filing rate against the county, from Eviction Lab or the court, with the hotspot rule |
| Investment and development | 3 | Named projects and anchors within a mile or two |
Two rules matter more in Ohio than they did in Kansas City. The data-limited crime rule. Kansas City publishes every incident with a location, so I can count what happened within a quarter mile of the house. That's how the Kansas City neighborhood rankings are built. Columbus, Dayton and Akron don't. For those I grade crime on the city's own FBI counts, violent plus property, 2022 against this year's pace, and I say in print that the grade is city-wide. It's a weaker grade and I treat it that way: each of those blocks shows what the score becomes if the street turns out worse than the city. The hotspot rule. Eviction Lab publishes the hundred buildings with the most filings in each city. When one building accounts for a quarter or more of a tract's filings, I grade the tract without it. A 300-unit complex's filings tell you nothing about the single-family street across the road. Columbus is the case on this page. The rule came out of the eviction hotspot work I did on 43 cities.
Full report means the complete run: geocode and tract, crime, the Census tables, rents, evictions, sales, jobs, schools, vouchers, tenancy length, the red-flag check, a scorecard with sensitivities, and a list of questions for a local property manager. All six blocks on this page are full reports. Where a figure couldn't be measured, the block says which ruling is open and what it would do to the score. When a ruling lands, the block is regraded and the changelog says so.
Ohio at a glance: six neighborhoods on one table
| Neighborhood | City | ZIP | Census tract | Score | Phase | Status | Data as of | One line |
|---|---|---|---|---|---|---|---|---|
| Old Brooklyn | Cleveland | 44144 | 1062 | 62 | 2 | Full report, quarter-mile crime | November 4, 2026 | Crime within a quarter mile down 29% this year against a flat city, evictions at a quarter of the city rate, vacancy at 4%, owners above the city, prices 1.3 times the city median. The weak point is a tract income figure that fell on a wide margin |
| Mid East (the listing called it Willis Park) | Columbus | 43227 | 93.11 | 60 | 2 | Full report, crime data-limited | November 4, 2026 | Real incomes up 54% and significant, owners above the city, jobs within 10 miles up 18%. A good neighborhood where the house I priced doesn't work at its asking price |
| South Akron | Akron | 44301 | 5045 | 51 | 2, fragile | Full report, crime data-limited, evictions pending | November 4, 2026 | Three points over the line, and the pending eviction count probably takes it under. 21% vacancy, a shrinking job base, the deepest voucher market I've measured |
| Norwood | Cincinnati | 45212 | 255 | 55 | 2 | Full report, crime data-limited; May 2026 count ruled a reporting batch, Norwood PD confirmation open | November 4, 2026 | The best sales market, schools and eviction figures on this page, and a $250 million district under way nearby. Graded as reported it would be 50 and Phase 1, so the crime ruling carries the phase |
| Bancroft Hills (Ottawa edge) | Toledo | 43607 | 24.01 | 49 | 1 | Full report, quarter-mile crime (six categories) | October 2 and 7, 2026; vouchers and flood November 4 | Rents in line with the market and evictions below the city rate, but 43% poverty, flat real incomes, short tenancies and shootings that rose through 2025. The duplex we passed on |
| Burkhardt | Dayton | 45403 | 23 | 43 | 1 | Full report, crime data-limited, evictions pending | November 4, 2026 | 28% of homes empty, 38% poverty, flat jobs. No single change gets it to Phase 2 |
The scores are rounded on this table and given to one decimal in each block. Phase 2 starts at 276 of 552 points, which is 50.0.
Is Old Brooklyn, Cleveland, a good neighborhood for a rental?
Score: 61.8 of 100, Phase 2. Full report, November 4, 2026. Crime graded on the quarter mile. The strongest tract on this page, and the one I'd buy in. Crime within a quarter mile is down 29% this year against a city that's flat. Evictions run at about a quarter of Cleveland's rate and at half the tract's own 2023 to 24 level. Vacancy fell from 11% to 4%, a quarter of the city's. Half the homes are owner-occupied, against four in ten citywide, and renters stay: only 1.5% of renter households moved in since 2021. Old Brooklyn sells at about 1.3 times the city median in under two weeks. Against it, the tract's income figure fell in real terms on a very wide margin, rent burden doubled, and a run of violent incidents on one street west in 2026 sits against a falling overall count.
Tract 1062 is in Old Brooklyn on Cleveland's southwest side, about 4.5 miles from downtown, with the Cleveland Metroparks Zoo a mile east. An October run of this tract scored 61.4; this is a fresh run on November data.
Key figures
| Measure | Old Brooklyn, tract 1062 | Compared with | Direction |
|---|---|---|---|
| Homes | 1,772 (68% single-family detached, 14% in duplexes; 36% built before 1940, 34% in the 1940s) | ||
| Median 3-bed asking rent | $1,700 on the two comparable 3-bed houses in 44144 (Redfin, Nov 4, 2026); a thin sample | HUD small-area rent, 44144: 3-bed $1,480, 2-bed $1,150 (FY2026) | Up: Census median rent $635 to $1,021 (2019 to 2024), +31% after inflation, significant; 108% of the city's $945 |
| Crime, quarter mile | All reports: 227 (2021), 189, 229, 238, 243 (2025); 2026 to Oct 144 against 203, −29.1%; 2026 pace 172 | Cleveland −1.0% on located cases this year; the tract −16%, Old Brooklyn as a whole −11% | Falling, faster than the city; level flat on 2022 (−8.8%) |
| Owner-occupied | 50.9% (2020 Census) | Cleveland 39.6% | Flat |
| Jobs within 5 miles (includes downtown) | 237,789 (2013) to 238,246 (2023), +0.2%; finance doubled, health care −14%, manufacturing −12%; 63% of jobs pay over $3,333 a month | Flat, with the mix moving up | |
| Poverty | 23.7% (2019) to 27.5% (2024) | Cleveland 30.6% | Flat |
| Median household income | $46,493 (2019) to $42,492 (2024), −25.5% in real terms, just outside the margin (±$13,400) | Cleveland $40,801 (104%) | Down, on a ±27% estimate |
| Vacancy | 10.7% to 3.7%, a fall of 140 homes, significant | Cleveland 15.6% | Down |
| Eviction filings | 12 in the year to June 2026, 1.4% of 828 renter households | Cleveland 5.3%; tract 0.27× the city | Falling: 0.50× its 2023 to 24 baseline while the city is at 1.08× and rising 26% year on year |
| Vouchers | 16 of 828 renter households (1.9%); average voucher rent $974 to $1,415 (2021 to 2025), 9.8% a year; 12.6 years' average tenure | Thin; the tenant pool is private | |
| Tenancies | 1.5% of renter households moved in since 2021; 68% in place since before 2018 | The most stable tenancy profile of any Ohio report | Long |
| Schools | Harper IB World School 5/10, Rhodes College and Career Academy 5/10, Rhodes School of Environmental Studies 5/10; CMSD is a choice district | Better than the Toledo, Dayton and Columbus sets | Flat |
| Sales | Old Brooklyn median $186,300 (+8.3%), 12 days, about 1% above list; ZIP 44144 $199,900 (+13.6%), 26 days; tract median value $74,000 to $112,200, significant | Cleveland $141,915 (+5.9%), about 33 days | Up |
Scorecard: 341 of 552 = 61.8
| Segment | Weight | Level | Trend | Points |
|---|---|---|---|---|
| Crime and safety (quarter mile) | 15 | 3 | ↑ | 60 |
| Rents and rent trend | 12 | 3 | ↑ | 48 |
| Sales market | 12 | 4 | ↑ | 60 |
| Demographics and income | 10 | 3 | ↓ | 20 |
| Employment (5-mile) | 8 | 2 | → | 16 |
| Schools | 8 | 3 | → | 24 |
| Housing stock and vacancy | 8 | 4 | ↑ | 40 |
| Owner-occupancy and stability | 6 | 4 | → | 24 |
| Voucher tenancy | 5 | 2 | → | 10 |
| Eviction climate | 5 | 5 | ↑ | 30 |
| Investment and development | 3 | 3 | → | 9 |
Sensitivity: crime trend flat at the next rerun, 59.1; crime Level 2 if the 2026 pace rises above 208, 59.1; demographics flat if the income fall is noise, 63.6; employment Level 3 on the size of the job base, 63.2; schools Level 2 on the district-wide rating, 60.3. Phase 2 holds under every change tested. No red flag is triggered. Cleveland's lead-safe certificate and rental registration apply to any pre-1978 rental.
What drives the grade
This is the only block on the page where crime is counted the way I count it in Kansas City: every incident the police published within 402 meters of the house, by distinct case number. Reports fell from 203 to 144 in the first ten months of 2026 against the same months a year earlier, a 29% fall, while Cleveland's located cases fell 1%. The city changed its records system in November 2025, and its citywide count barely moved across the change, so the local fall is real. On the 2022 base the level is flat at Level 3, because 189 reports then against a pace of 172 now is inside my 10% band. The violent incidents cluster on the Memphis Avenue and Fulton Road commercial corridors, and in 2026 on the 4400 block of W 53rd Street, one street west of the house I graded. That street is a question for the property manager, not a reason to downgrade a tract.
Evictions, vacancy and ownership are what a Phase 2 tract looks like. Twelve eviction filings in a year across 828 renter households is 1.4%, a quarter of Cleveland's rate, in a city where filings rose 18.7% in the year to June 2026 and 26% in the first half of this year. The tract is at half its own 2023 to 24 level. Vacancy fell from 11% to 4%, a significant drop of 140 homes, against a city at 16%. Half the homes are owner-occupied against four in ten citywide. And renters stay put: two-thirds of renter households have been in place since before 2018, and almost none moved in since 2021.
The income figure is the weak call. The tract's median fell from $46,493 to $42,492, which is a 25% fall after inflation, and the fall is just larger than the combined margin, so the rule says down. The 2024 estimate carries a margin of 27%, though, and poverty and unemployment both sit below the city's. If the fall is noise the score is 63.6. Rent burden did double, from 29% to 59% of renters paying over 30% of income, because rents rose 31% in real terms while incomes didn't. That's a tenant pool being stretched, and it's the figure I'd watch here.
Prices run ahead of the city. Old Brooklyn's median sale was $186,300 in Redfin's last full month, 1.3 times Cleveland's, in 12 days at about 1% over list, and the tract's median value rose from $74,000 to $112,200 on a significant margin. The job base within five miles is flat in count, but finance jobs doubled and 63% of jobs now pay over $3,333 a month. The Cleveland Clinic and University Hospitals sit just outside the five-mile buffer; MetroHealth is inside it.
Before buying here
- A Cleveland Lead Safe Certificate in hand, or a priced path to one, on any pre-1978 house, and the rental registration confirmed. The city won't grant an eviction without the Certificate Approving Rental Occupancy.
- A property manager's view of the 4400 block of W 53rd Street and the Memphis and Fulton corridors.
- The renovation on any recent flip: permits, electrical, roof, basement water. The house I graded sold for $47,800 in 2024 and went through four list prices in 20 months.
- A full-replacement insurance quote on a 1910s frame house.
- The rent ledger. At $1,500 the house I graded sits between the Rent Zestimate and the larger comps, which is a full rent for 924 square feet with one bath and no central air.
The Old Brooklyn house is the Cleveland row of the seven-house table in the Ohio hub. Cleveland is the one Ohio market I work in. The Cleveland guide covers the west and east sides, the old systems and the city rules. Daniel, a client who bought here and in Kansas City, shows what owning from abroad looks like.
Cleveland sources:
- Census geocoder.
- Cleveland Division of Police incident data, both records systems, queried with a 402 m buffer to Nov 4, 2026.
- ACS 2015 to 2019 and 2020 to 2024, 2020 Census DHC.
- LEHD LODES 8.
- HUD Picture of Subsidized Households 2021 and 2025.
- Eviction Lab, Cleveland tract and monthly files, Jul 2025 to Jun 2026.
- Redfin 44144, Old Brooklyn and Cleveland.
- HUD Small Area FMRs.
- GreatSchools via Zillow.
- FEMA.
Is Mid East, Columbus, a good neighborhood for a rental?
Score: 59.8 of 100, Phase 2. Full report, November 4, 2026. Crime graded on city-wide data. A good neighborhood on the numbers I can see. Real incomes are up by half, and the rise is statistically significant. Poverty is down from 26% to 20%. Owners are above the city average, and there are 75,000 more jobs within ten miles than a decade ago. The grade would survive every single change I tested. The house I ran it for doesn't work at its asking price, which is a different question and lives in the hub.
Tract 93.11 is in the city's Mid East community, 7.2 miles east of downtown, so the jobs buffer is ten miles. The listing called the area Willis Park; the city's layers don't use that name.
Key figures
| Measure | Mid East, tract 93.11 | Compared with | Direction |
|---|---|---|---|
| Homes | 1,298 (68% single-family detached, 10% mobile homes, none built since 2010) | ||
| Median 3-bed asking rent | $1,560, 8 houses in 43227 (Redfin, Nov 4, 2026); 4-bed $1,745 | HUD small-area rent, 43227: 3-bed $1,620, 4-bed $1,820 (FY2026) | Flat in real terms: Census median rent $935 to $1,295, +12.9% after inflation, inside the margin |
| Crime | Columbus PD, FBI counts: 37,393 (2022) to 27,461 (2025); 2026 on pace for 25,400, −32% | City only; no address-level data | Falling, city-wide |
| Owner-occupied | 49.8% (2020 Census) | Columbus 42.4% | Flat (ACS shows a rise inside the margin) |
| Jobs within 10 miles | 420,115 (2013) to 495,360 (2023), +17.9% | 5-mile check +9.6% | Up |
| Poverty | 26.4% (2019) to 20.0% (2024) | Columbus 18.1% | Down |
| Median household income | $32,250 (2019) to $60,862 (2024), +53.8% in real terms, significant | Columbus $66,082 (92% of the city) | Up |
| Vacancy | 2.3% to 7.9% | Columbus 8.2% | Rising, from a figure too thin to trust |
| Eviction filings | 136 in the year to Sep 2026, 2.20× the county rate on paper; 113 are one complex, so about 0.5× without it | Franklin County 9.5% of renter households | Flat (0.99× its 2023 to 24 baseline) |
| Vouchers | 36 of 644 renter households (5.6%); average voucher rent $1,151 to $1,690 (2021 to 2025); 15 years' average tenure | Count falling, rents rising fast | |
| Tenancies | 8.4% of renter households moved in since 2021; 70% in place since before 2018 | Long | |
| Schools | Shady Lane Elementary 4/10, Sherwood Middle 4/10, Walnut Ridge High 3/10 (Columbus City Schools) | Flat | |
| Sales | ZIP 43227 median $212,408 (+4.2%), 64 sales, 50 days, 98.2% of list | Columbus about $288,500 | Flat |
Scorecard: 330 of 552 = 59.8
| Segment | Weight | Level | Trend | Points |
|---|---|---|---|---|
| Crime and safety (FBI city-wide, data-limited) | 15 | 5 | → | 75 |
| Rents and rent trend | 12 | 3 | → | 36 |
| Sales market | 12 | 3 | → | 36 |
| Demographics and income | 10 | 3 | ↑ | 40 |
| Employment (10-mile) | 8 | 4 | ↑ | 40 |
| Schools | 8 | 2 | → | 16 |
| Housing stock and vacancy | 8 | 3 | → | 24 |
| Owner-occupancy and stability | 6 | 4 | → | 24 |
| Voucher tenancy | 5 | 2 | → | 10 |
| Eviction climate (hotspot-adjusted) | 5 | 4 | → | 20 |
| Investment and development | 3 | 3 | → | 9 |
Sensitivity: crime at Level 3 instead of the city trajectory, 54.3; evictions on the raw rate with the red flag, 57.1; both together, 51.6; evictions Level 5, 60.7. Phase 2 holds under every change tested.
What drives the grade
Income is the story. The tract's median household income went from $32,250 to $60,862 in five years. That's a 54% rise after inflation, with a margin of about $13,700, so the rise is real and not sampling noise. It's now 92% of the city's. Poverty fell by a quarter and rent burden fell from 71% of renters paying over 30% of income to 48%. That's the Phase 2 pattern. The people who live there are doing better, and the housing stock hasn't caught up with them yet. It's why the tract's homes are still valued at about half the city median.
The crime grade carries 75 of the 330 points and rests on city-wide data. Columbus's FBI counts are down a third since 2022, which is Level 5 on my rule. But the east side runs from stable 1950s owner streets to troubled apartment pockets, and the FBI file can't tell you which this is. If the quarter mile looks worse than the city on the police department's public map, the grade is Level 3 and the score is 54.3, still Phase 2.
Evictions are the trap for anyone reading the tract file cold. The raw rate is 2.2 times the county, which would be a red flag. Eighty-three percent of the filings come from one apartment complex about 0.4 miles from the house, the fourth most-filing building in Columbus. Take it out and the streets around the house file at about half the county rate. I grade on the adjusted rate and say so. The corridor has several high-filing complexes, and the single-family streets are a different market from them. That's the hotspot rule doing its job.
Renters stay: 70% of renter households have been in place since before 2018. Vouchers are thin here, 5.6% of renters, but the voucher rents rose 10% a year from 2021 to 2025 and the average voucher tenancy is 15 years. That's the kind of tenant pool I mean when I say Section 8 is neither guaranteed nor passive, but it can be long. Schools are weak, as they are in every urban Ohio district I've graded.
Before buying here
- The quarter-mile crime view on the Columbus police public map. It decides whether crime is Level 5 or Level 3.
- The unit count at the hotspot complex, and whether it's visible from the street you're buying on.
- The assigned schools, confirmed with Columbus City Schools.
- The Franklin County Auditor's current value and any pending update, because a reset to the purchase price moves the tax bill well past my 15% allowance.
- A quote on any 1950s house's systems; the one I priced had dead central air.
Sources for this block:
- Census geocoder.
- City of Columbus GIS neighborhood layers.
- FBI Crime Data Explorer, Columbus PD.
- ACS 2015 to 2019 and 2020 to 2024, 2020 Census DHC.
- LEHD LODES 8.
- HUD Picture of Subsidized Households 2021 and 2025.
- Eviction Lab Columbus tract file and hotspots, Oct 2025 to Sep 2026.
- Redfin 43227.
- HUD Small Area FMRs.
- FEMA.
Is Norwood, Cincinnati, a good neighborhood for a rental?
Score: 55.1 of 100, Phase 2. Full report, November 4, 2026. Crime graded on city-wide data, under a ruling on one month. The best location on this page on four of the eleven segments. The sales market is up 12.7% in a year. The schools are the strongest of any Ohio report. Evictions run at 0.6 times the county and are falling faster than the county. And a $250 million mixed-use district is under way nearby. Poverty halved from 30% to 17%, and that fall is significant. The grade rests on one ruling: Norwood's police counts show 130 property offenses in May 2026 against 21 to 64 in every other month of 2025 and 2026, and I've treated that month as a batch of older reports. Graded as filed, the tract is 49.6 and Phase 1. Norwood PD's confirmation is a condition of buying here.
Tract 255 is in the City of Norwood, an independent city inside Cincinnati with its own police, schools and municipal income tax, 4.7 miles northeast of downtown Cincinnati.
Key figures
| Measure | Norwood, tract 255 | Compared with | Direction |
|---|---|---|---|
| Homes | 50% single-family, 13% duplex, about 230 in 3 to 4 unit buildings, about 500 in 5+; 73% built 1939 or earlier; about 176 units added since 2019 | ||
| Median asking rent | 1-bed $983 (14 listings in 45212); 3-bed in 2 to 4 unit buildings $1,813 (6 listings) | HUD small-area rent: 1-bed $1,050; 3-bed $1,640 to $1,780 | Flat in real terms: Census median rent $695 to $941 |
| Crime | Norwood PD, FBI counts: 609 (2022), 712, 655, 663 (2025). With May 2026 set to May 2025's 51, Jan to Aug is 353 against 425 and the 2026 pace is 551, −9.6% on 2022. As filed: 432, pace 674, +10.7% | Cincinnati 44.6 per 1,000 residents; Norwood 34.7. This year −16.9% against Cincinnati's +0.1% | Falling, faster than Cincinnati, on the ruled count |
| Owner-occupied | 39.7% (2020 Census) | Norwood 45.5% | Flat |
| Jobs within 5 miles (includes downtown Cincinnati) | 239,152 (2013) to 255,623 (2023), +6.9%; health care +25%, professional +22%, finance +25% | Up | |
| Poverty | 30.4% (2019) to 16.7% (2024), 600 fewer people, significant | Level with Norwood | Down |
| Median household income | $40,792 (2019) to $60,508 (2024), +20.9% in real terms, not significant (margin ±$22,800) | Norwood $71,611 (84%); Cincinnati 114% | Up, inside the margin |
| Vacancy | 12.4% to 19.6% (+175 homes, just significant; some may be new units in lease-up) | Rising | |
| Eviction filings | 53 in the year to Sep 2026, 5.2% of 1,018 renter households | Hamilton County 8.7%; tract 0.60× county | Falling: 0.71× its 2023 to 24 baseline against the county's 0.97× |
| Vouchers | 63 of 1,018 renter households (6.2%); average voucher rent $1,002 to $1,338 (2021 to 2025), 7.5% a year; 9 years' average tenure | Rents rising | |
| Tenancies | 3.2% of renter households moved in since 2021; 71% in place since before 2018 | Long | |
| Schools | Sharpsburg Elementary 5/10, Norwood Middle 6/10, Norwood High 5/10 (Norwood City Schools) | The best set of any Ohio report | Flat |
| Sales | ZIP 45212 median $309,816 (+12.7%), 105 sales, 42 days, 99.5% of list; tract median value $105,800 to $219,400 (2019 to 2024) | Up | |
| Investment | Factory 52, a $250M mixed-use district on the former U.S. Playing Card site, phase 1B under way since late 2023; Rookwood retail nearby | Up |
Scorecard: 304 of 552 = 55.1
| Segment | Weight | Level | Trend | Points |
|---|---|---|---|---|
| Crime and safety (Norwood FBI, data-limited, May 2026 ruled a batch) | 15 | 3 | ↑ | 60 |
| Rents and rent trend | 12 | 3 | → | 36 |
| Sales market | 12 | 4 | ↑ | 60 |
| Demographics and income | 10 | 3 | → | 30 |
| Employment (5-mile) | 8 | 3 | → | 24 |
| Schools | 8 | 3 | → | 24 |
| Housing stock and vacancy | 8 | 2 | ↓ | 8 |
| Owner-occupancy and stability | 6 | 2 | → | 12 |
| Voucher tenancy | 5 | 2 | → | 10 |
| Eviction climate | 5 | 4 | ↑ | 25 |
| Investment and development | 3 | 4 | ↑ | 15 |
Sensitivity: crime as filed, Level 2 flat, 49.6 and Phase 1; crime Level 3 flat with no trend credit, 52.4; housing flat instead of worsening, 56.5; demographics improving (the poverty fall is significant), 56.9; investment Level 3, 54.0. Phase 2 holds under every change except grading May 2026 as filed.
What drives the grade
Norwood has the best fundamentals on this page outside Cleveland. The sales market is the strongest of the six. The ZIP's median sale price is up 12.7% in a year, and homes sell in 42 days at 99.5% of list. The tract's own median value doubled from $105,800 to $219,400 between the two Census windows, which is a significant rise. Poverty halved, and that's significant too. The eviction rate is 0.6 times the county and fell faster than the county did. That matters in a state where the eviction process runs five to eight weeks on paper and longer in practice. Norwood runs its own schools and they rate 5 to 6 out of 10, which no Cleveland, Toledo, Dayton or Columbus assignment on this page gets near. And Factory 52, a $250 million district with 300 apartments, a food hall and retail, is being built a short distance away.
The crime grade is a ruling, and I want to be plain about it. Norwood publishes no incident data, so the grade uses the FBI counts for Norwood's own police department. As filed, they put 2026 on pace for 10.7% more offenses than 2022, which is Level 2 and a Phase 1 score of 49.6. But May 2026 shows 130 property offenses when every other month of 2025 and 2026 shows 21 to 64. That pattern usually means a batch of older reports was entered in one month, and on November 4 I ruled it one. With May set to the previous May's 51, the pace is 9.6% below 2022, Level 3, and this year's fall of 17% beats Cincinnati's flat count, so the trend is up. That's 30 points and the phase. Confirming it with Norwood PD is the first condition on any purchase here, and if they say the May count is real, this block goes back to 49.6.
Two things cut the other way. Vacancy rose from 12% to 20%, and the rise is just significant. The tract added about 176 units in the period, though, and some of the empty homes may be new apartments still leasing up. And only 40% of homes are owner-occupied, against 45% in Norwood as a whole, with half the stock in buildings of three units or more. Real income is up 21% but inside a wide margin, so it stays flat.
Before buying here
- Norwood PD: was May 2026 a batch of older reports? The grade rests on it; as filed the tract is 49.6 and Phase 1.
- The Hamilton County Auditor's 2026 update value and projected bill; the house I priced faces a tax reset of about $1,600 a year.
- Norwood's municipal income tax on net rental profit, and whether Norwood has a rental registration.
- A contractor walk-through on any pre-1940 building: roof, both furnaces, water heaters, panel, and lead-paint compliance. Maintenance, repairs and capital are three different costs, and a 1913 duplex carries all three.
- Whether the vacancy rise is lease-up or something else; a drive down the block answers it.
Where the Norwood figures come from:
- Census geocoder.
- FBI Crime Data Explorer, Norwood PD and Cincinnati PD.
- ACS 2015 to 2019 and 2020 to 2024, 2020 Census DHC.
- LEHD LODES 8.
- HUD Picture of Subsidized Households.
- Eviction Lab Cincinnati tract file and hotspots.
- Zillow and Redfin 45212.
- HUD Small Area FMRs.
- Local 12 on Factory 52.
- FEMA.
Is South Akron a good neighborhood for a rental?
Score: 50.5 of 100, Phase 2 by three points, fragile. Full report, November 4, 2026. Crime graded on city-wide data; evictions pending. A near-average Akron tract: income at 96% of the city's, poverty at 20% against the city's 23%, owners at 49% against 50%. The three points above the line come from two segments, Akron's city-wide crime fall and the deepest voucher market I've measured. Against them: 21% of homes empty, three-quarters of the stock built before 1940, and a job base that shrank 3% in ten years. And an eviction count I haven't run yet, in a city reported to have Ohio's highest eviction rate. Treat it as Phase 1 until that count is in.
Tract 5045 is in South Akron, 2.1 miles south of downtown.
Key figures
| Measure | South Akron, tract 5045 | Compared with | Direction |
|---|---|---|---|
| Homes | 79% single-family detached; 76% built 1939 or earlier | ||
| Median asking rent | 4-bed houses in 44301 $1,250 (6 listings, $1,095 to $1,395); all houses $1,200 average, −$100 on a year ago, 49 days to let | HUD small-area rent, 44301: 3-bed $1,570, 4-bed $1,710 (FY2026) | Falling in real terms: Census median rent $870 to $961, −10% after inflation, inside the margin |
| Crime | Akron PD, FBI counts: 8,224 (2022) to 7,066 (2025); 2026 on pace for 5,473, −33%, with a possible reporting gap in Feb and Mar 2026; on Jun to Aug alone, −29% | 37.3 per 1,000 residents (2025); city only | Falling, city-wide |
| Owner-occupied | 49.0% (2020 Census) | Akron 49.8% | Flat |
| Jobs within 5 miles | 110,178 (2013) to 106,763 (2023), −3.1%; manufacturing −12%, retail −15%, education −18% | The only Ohio tract on this page with a falling job count | Down |
| Poverty | 23.3% (2019) to 19.8% (2024) | Akron 23.3% | Down |
| Median household income | $33,219 (2019) to $46,012 (2024), +12.9% in real terms, not significant (margin ±$9,300) | Akron $48,076 (96%) | Up, inside the margin |
| Vacancy | 13.2% to 21.0% (+60 homes, margin ±88, not significant) | Akron 9.6%; 2.2 times the city | Rising, inside the margin |
| Eviction filings | Pending: Eviction Lab doesn't cover Akron; fill from Akron Municipal Court filings against 334 renter households | Akron reported as Ohio's highest eviction rate; 3,055 city filings in 2024 | Expected Level 2 |
| Vouchers | 90 of 334 renter households (26.9%), the deepest voucher market in any report so far; two-thirds 3+ bedrooms; average voucher rent $833 to $864 (2021 to 2025); 9 years' average tenure | Flat | |
| Tenancies | 4.5% of renter households moved in since 2021; 75% in place since before 2018 | Long | |
| Schools | McEbright Elementary 5/10, Innes Community Learning Center 3/10, Garfield High 4/10 (Akron Public Schools, per the listing) | Flat | |
| Sales | ZIP 44301 median $139,919 (−4.8%), 70 sales (+14.5%), 27 days, 99.8% of list; tract median value $52,800 to $78,300 | Akron about $122,000 | Flat |
Scorecard: 279 of 552 = 50.5
| Segment | Weight | Level | Trend | Points |
|---|---|---|---|---|
| Crime and safety (FBI city-wide, data-limited) | 15 | 5 | → | 75 |
| Rents and rent trend | 12 | 3 | → | 36 |
| Sales market | 12 | 3 | → | 36 |
| Demographics and income | 10 | 3 | → | 30 |
| Employment (5-mile) | 8 | 2 | ↓ | 8 |
| Schools | 8 | 2 | → | 16 |
| Housing stock and vacancy | 8 | 2 | → | 16 |
| Owner-occupancy and stability | 6 | 3 | → | 18 |
| Voucher tenancy | 5 | 4 | → | 20 |
| Eviction climate | 5 | 3 (pending) | → | 15 |
| Investment and development | 3 | 3 | → | 9 |
Sensitivity: evictions Level 2, 49.6 and Phase 1; vouchers Level 3, 49.6; crime Level 4, 47.8; crime Level 3, 45.1; employment flat instead of falling, 52.0. Phase 2 holds only if crime stays Level 5 and evictions come in at Level 3 or better.
What drives the grade
Akron's city-wide crime count is down a third since 2022 on the FBI file, and that one segment is 75 of the tract's 279 points. February and March 2026 look under-reported (235 and 208 offenses against 356 and 442 a year earlier). So I re-ran the pace on June to August alone. It's still a 29% fall, still Level 5. But it's a city grade, not a street grade, and Akron publishes no incident map I can count from. If the quarter mile is worse than the city, the tract is 47.8 or 45.1 and Phase 1.
The second prop is vouchers. Ninety of the tract's 334 renter households hold a voucher, 27%, and the average voucher tenancy is over nine years on HUD's numbers. That's a deep, stable tenant pool for a 3 or 4-bed house, and it's why I grade voucher tenancy Level 4. The flip side is that voucher rents here rose less than 1% a year from 2021 to 2025, so the market isn't pulling the payment standard up.
Everything else is flat or soft. Jobs within five miles fell 3.1% in ten years, the only falling count among the Ohio tracts on this page, with manufacturing, retail and education all down. A fifth of the homes are empty, more than twice the city's rate, and three-quarters were built before 1940. Rents in the ZIP are $100 a month lower than a year ago and houses take 49 days to let, which is longer than a vacancy should take in a market that's working. And the eviction count, which is the open ruling, is likely to come in at Level 2 given what's been reported about Akron's filing rate. That alone takes the score to 49.6.
Before buying here
- Akron Municipal Court filings for the block, divided by the tract's 334 renter households. This decides the phase.
- The quarter-mile view on the Akron police map, and a street walk; 21% vacancy shows up on a walk.
- Summit County Fiscal Office: owner, acquisition and the 2026 reappraisal. The actual 2025 bill on the house I priced was $2,083, not the seller's $1,898.
- AMHA's 4-bed payment standard against any projected rent, remembering that fair market rent is not your rent; a signed lease or voucher approval before closing.
- An insurance quote on a wood-sided 1920s house. The house I priced came with a turnkey seller's sheet, and the ten checks I run on a seller's numbers apply to it.
Akron sources:
- Census geocoder.
- FBI Crime Data Explorer, Akron PD.
- ACS 2015 to 2019 and 2020 to 2024, 2020 Census DHC.
- LEHD LODES 8.
- HUD Picture of Subsidized Households.
- LSC Civil Court Data Initiative, Summit County.
- Community Legal Aid's 2024 count, reported by WYSU.
- Zillow and Trulia 44301.
- HUD Small Area FMRs.
- Redfin.
- FEMA.
Is Bancroft Hills, Toledo, a good neighborhood for a rental?
Score: 49.3 of 100, Phase 1. Full report, October 2, 2026, crime re-pulled October 7, voucher and flood data added November 4. This is the duplex we passed on, and the neighborhood is why. The strengths are real. Rents of $2,200 across two units were in line with the market. Eviction filings run at three-quarters of the Toledo rate. Jobs within five miles grew, and the tract's rent rise since 2019 is significant. But real incomes are flat and poverty is 43%. Six in ten homes are rented and tenancies run two to four years. The schools are weak and slipping. Shootings within a quarter mile rose from 4 to 12 between 2023 and 2025 before easing this year. Steady demand from a university and a hospital holds a weak neighborhood steady. It doesn't make it better.
Tract 24.01 is Bancroft Hills on the city's own layers, on the edge of Ottawa, with the University of Toledo 0.6 miles away and ProMedica Toledo Hospital a mile.
Key figures
| Measure | Bancroft Hills, tract 24.01 | Compared with | Direction |
|---|---|---|---|
| Homes | 59% built before 1940, 87% before 1980; 41 vacant parcels within a quarter mile | ||
| Median 3-bed asking rent | $1,295, 30 listings within 1.5 miles (Zillow, Oct 2, 2026); 2-bed $875; 3-bed units in small multifamily $1,350 | HUD Toledo metro FMR: 2-bed $1,145, 3-bed $1,461 (FY2027); LMH payment standard 3-bed $1,518 | Up: Census median rent $741 to $963 (2019 to 2024), significant; +5.9% after inflation |
| Crime, quarter mile | Six categories only: 41 (2023), 46 (2024), 30 (2025); 2026 to Oct 1 at 25 against 26, −3.8%. Violent 4, 7, 12, then 9 to date against 10 | About the Toledo average, and Toledo runs about 2.9 times the national violent rate | Flat; property crime down, shootings up through 2025 |
| Owner-occupied | 41.1% (2024 ACS); 39.3% in 2017 | Toledo 53.3% | Flat, with stability rising: 83% in the same house as a year ago, up from 73% |
| Jobs within 5 miles | 117,312 (2013) to 122,634 (2023), +4.5%; health care 23% of jobs | Up, modestly | |
| Poverty | 40.0% (2017) to 43.4% (2024) | Toledo 24.3%; partly students | Flat |
| Median household income | $33,536 (2017) to $41,162 (2024), about −4% in real terms, not significant | Toledo $49,724 (83%) | Flat |
| Vacancy | 18.5% to 11.7% | Toledo 10.6% | Down |
| Eviction filings | 71 in about 12 months, 8.6% of about 826 renter households | Toledo 11.2%; tract 0.77× the city, 56th of 124 tracts | +7% on the 2023 to 24 baseline, city +5% |
| Vouchers | 46 of about 826 renter households (5.6%), up from 36; average voucher rent $906 to $1,204 (2021 to 2025), 7.4% a year; 7 years' average tenure. LMH pays one standard at 110% of the metro FMR, above local asking rents by $300 a month on a 2-bed and $220 on a 3-bed | Growing (LMH cut standards from 120% to 110% in 2025) | |
| Schools | Old Orchard Elementary 4/10, Start High 1/10; Toledo Public Schools fell to 2 stars on the 2024 to 25 state report card | Down | |
| Sales | ZIP 43607 median $101,477 (+6.8%), 57 sales, 50 days, 95.7% of list; duplexes $75,000 to $82,000 a unit | Toledo $149,901 | Up, from a low level |
| Tenancies | 57% of renters moved in since 2020; median renter move-in 2021; about 2 to 4 years | Toledo median 2018 | Short |
Scorecard: 272 of 552 = 49.3
| Segment | Weight | Level | Trend | Points |
|---|---|---|---|---|
| Crime and safety (quarter mile, six categories) | 15 | 3 | → | 45 |
| Rents and rent trend | 12 | 3 | ↑ | 48 |
| Sales market | 12 | 2 | ↑ | 36 |
| Demographics and income | 10 | 2 | → | 20 |
| Employment (5-mile) | 8 | 3 | ↑ | 32 |
| Schools | 8 | 2 | ↓ | 8 |
| Housing stock and vacancy | 8 | 2 | → | 16 |
| Owner-occupancy and stability | 6 | 2 | ↑ | 18 |
| Voucher tenancy | 5 | 4 | → | 20 |
| Eviction climate | 5 | 4 | → | 20 |
| Investment and development | 3 | 3 | → | 9 |
One conditional red flag: a vacant lot next door to the house I graded. Flood cleared, no mapped zone within 250 m. Toledo's lead-safe rule applies to any pre-1978 rental of one to four units.
What drives the grade
Toledo's crime map tracks six categories and nothing before 2023, so I can't run my trajectory rule here. The level is a documented judgment. The area runs about the Toledo average, and Toledo runs about three times the national violent rate. Within the quarter mile, property crime fell sharply while shootings rose from 4 to 12 across 2023 to 2025. Two homicides inside the quarter mile, in October 2024 and April 2026. Level 3, flat.
The people figures are the Phase 1 signature. Nominal income rose 23%, but after inflation it's down about 4% and the change isn't significant. Poverty is 43% against the city's 24%, part of it students from the university up the road. Six in ten homes are rented and tenancies are short, with 57% of renter households moved in since 2020. Short tenancies mean turnover, which is the largest running cost on a rental. Toledo Public Schools dropped to two stars on the state report card, and the assigned high school rates 1 of 10 with a 74% graduation rate.
What's good is also real, which is why this is 49 and not 40. The tract's median rent rose 30% from 2019 to 2024, a significant rise that beat inflation. Evictions run at 0.77 times the Toledo rate. The job base grew 4.5%, with health care as the anchor and the Jeep plant five miles away. Prices are rising from a low base. The vacancy rate fell from 19% to 12%. None of it adds up to a neighborhood that's improving in the way the people who live there would feel. Demand that holds a weak area steady is not the same as a neighborhood getting better.
On the deal itself, which is priced in the hub. On a Toledo duplex the landlord usually pays water, sewer, storm water and refuse, which I estimated at about $1,600 a year. With Toledo's eviction rate I budget a 15% reserve for vacancy and unpaid rent, not 10%. Those two lines, plus a $2,661 full-replacement insurance quote, took 39% of the rent before management or repairs, and that's why we passed. The Toledo row is also on the national cash flow markets page.
Before buying here
- The Lead-Safe Certificate: Toledo requires one on pre-1978 rentals of one to four units before a new tenant moves in. Inspection about $400 plus repairs.
- The vacant parcels within a quarter mile, 41 at the last count, and who owns the one next door.
- School assignment confirmed with Toledo Public Schools; the report inferred it from neighboring listings.
- LMH's current payment standard against the unit rents; voucher tenancies here run seven years against two to four for private renters.
- The Lucas County AREIS record for year built, value and sale history; it was down when the report was run.
Where the Toledo figures come from:
- Census geocoder.
- City of Toledo neighborhoods and police beat layers.
- Toledo Police public crime map, shootings and homicides layers (2023 to Oct 1, 2026).
- AreaVibes, Ottawa.
- Lucas County Auditor vacant parcels.
- ACS 2013 to 2017 and 2020 to 2024.
- Census LEHD OnTheMap.
- GreatSchools.
- Zillow and Zumper 43607.
- HUD FMR history.
- LMH payment standards.
- Eviction Lab, Toledo.
- Redfin 43607 and Ottawa.
- Toledo Lead Safe.
- University of Toledo master plan.
Is Burkhardt, Dayton, a good neighborhood for a rental?
Score: 42.6 of 100, Phase 1. Full report, November 4, 2026. Crime graded on city-wide data; evictions pending. The weakest neighborhood on this page, and no single change I tested gets it to Phase 2; it would take about 41 points. More than a quarter of the homes are empty and poverty is 38%. The job base within five miles is flat. Dayton's crime rate is the highest of the four Ohio cities I've run on FBI data. The metro is growing from a low base. This tract isn't.
Tract 23 is Burkhardt, 2.0 miles east of downtown Dayton.
Key figures
| Measure | Burkhardt, tract 23 | Compared with | Direction |
|---|---|---|---|
| Homes | 1,281; 364 vacant; 68.5% built 1939 or earlier; 15 built since 2000 | ||
| Median 3-bed asking rent | $1,280, 16 houses in 45403 (Zillow, Nov 2026), 38 days to let | HUD small-area rent, 45403: 3-bed $1,200 (FY2025) to $1,280 (FY2026) | Flat in real terms: Census median rent $693 to $913, margin ±$282 |
| Crime | Dayton PD, FBI counts: 7,558 (2022) to 7,152 (2025); 2026 on pace for 7,283, −3.6% | 52.4 per 1,000 residents (2025), against Columbus 30.0, Akron 37.3, Cincinnati 44.6; city only | Flat, city-wide |
| Owner-occupied | 39.2% (2020 Census) | Dayton 45.2% | Flat |
| Jobs within 5 miles | 127,835 (2013) to 128,394 (2023), +0.4%; manufacturing −15%, retail −24%, professional +18% | Flat | |
| Poverty | 38.3% (2024) | Dayton 26.9% | Flat |
| Median household income | $38,911 (2024), +27.7% in real terms since 2019, not significant (margin ±$11,000) | Dayton $45,247 (86%) | Up, inside the margin |
| Vacancy | 28.4% | Dayton 16.9% | High |
| Eviction filings | Pending: Eviction Lab doesn't cover Dayton; fill from Dayton Municipal Court | Montgomery County reported among Ohio's highest-filing counties; about 3,000 city filings a year | Expected Level 2 to 3 |
| Vouchers | 30 of 641 renter households (4.7%); average voucher rent $961 to $1,048 (2021 to 2025); 12 new project-based units in 2025 | Flat | |
| Tenancies | 3.1% of renter households moved in since 2021; 50% in place since before 2018 | Long | |
| Schools | Ruskin PK-8 3/10, Wright Brothers 2/10 (Dayton Public); Stivers 6/10 is a magnet, not the default | Flat | |
| Sales | ZIP 45403 median $139,939 (+20.4%), 21 days, 97.5% of list; Burkhardt $140,000 on 46 sales, 18 days; tract owner value $43,000 ±$17,000 | Dayton $149,829 (+7.3%) | Up |
Scorecard: 235 of 552 = 42.6
| Segment | Weight | Level | Trend | Points |
|---|---|---|---|---|
| Crime and safety (FBI city-wide, data-limited) | 15 | 3 | → | 45 |
| Rents and rent trend | 12 | 3 | → | 36 |
| Sales market | 12 | 3 | ↑ | 48 |
| Demographics and income | 10 | 2 | → | 20 |
| Employment (5-mile) | 8 | 2 | → | 16 |
| Schools | 8 | 2 | → | 16 |
| Housing stock and vacancy | 8 | 1 | → | 8 |
| Owner-occupancy and stability | 6 | 2 | → | 12 |
| Voucher tenancy | 5 | 2 | → | 10 |
| Eviction climate | 5 | 3 (pending) | → | 15 |
| Investment and development | 3 | 3 | → | 9 |
No single sensitivity change reaches Phase 2.
What drives the grade
The housing stock grades Level 1, the only Level 1 on this page. Three hundred and sixty-four of the tract's 1,281 homes are empty, 28% against the city's 17%, and 15 homes have been built since 2000. That's not a neighborhood where owners are reinvesting. Poverty is 38%, against 27% for a city that is itself one of Ohio's poorer ones, and fewer than four in ten homes are owner-occupied.
The one segment pulling up is sales. The ZIP's median sale price rose 20% in a year to about $140,000, homes sell in three weeks, and Burkhardt itself recorded 46 sales at a $140,000 median. Part of that is investors buying cheap houses, which is what a 20% rise on a $116,000 base looks like, and part is a Dayton market that's growing again. Cheap is also where a loan under $100,000 gets harder to find. It's worth a level and a trend, not more.
Crime is graded on Dayton's FBI counts, which are down 3.6% since 2022, Level 3 and flat. Dayton's rate, 52 offenses per 1,000 residents, is the highest of the four Ohio cities I've run this way, and the tract has no address-level map to check against it. Income rose 28% after inflation but inside a margin of $11,000, so it stays flat. Jobs within five miles are flat over ten years, with manufacturing and retail down and professional services up. The schools are 3 and 2 out of 10; the magnet school that rates 6 isn't the default assignment.
Before buying here
- The quarter-mile view on the Dayton police map and a street walk. Twenty-eight percent vacancy is visible from the car.
- Dayton Municipal Court filings for the block; the eviction grade is pending.
- The Montgomery County Auditor's 2026 reappraisal and projected bill; the seller's figure on the house I priced was five times the current bill.
- Dayton's rental registration status for the property.
- Lease, ledger and the tenant's renewal intention; the house I priced was let $200 under market to January 2027.
Dayton sources:
- Census geocoder.
- FBI Crime Data Explorer, Dayton PD.
- ACS 2015 to 2019 and 2020 to 2024, 2020 Census DHC.
- LEHD LODES 8.
- HUD Picture of Subsidized Households.
- Dayton Daily News on county eviction rates.
- Zillow 45403 and Zillow Rental Manager.
- HUD Small Area FMRs.
- Redfin 45403, Burkhardt and Dayton.
- FEMA.
What do the six grades say side by side?
| Segment (weight) | Old Brooklyn | Mid East | South Akron | Norwood | Bancroft Hills | Burkhardt |
|---|---|---|---|---|---|---|
| Crime (15) | 3 ↑ | 5 → city | 5 → city | 3 ↑ city, ruled | 3 → | 3 → city |
| Rents (12) | 3 ↑ | 3 → | 3 → | 3 → | 3 ↑ | 3 → |
| Sales (12) | 4 ↑ | 3 → | 3 → | 4 ↑ | 2 ↑ | 3 ↑ |
| Demographics (10) | 3 ↓ | 3 ↑ | 3 → | 3 → | 2 → | 2 → |
| Employment (8) | 2 → | 4 ↑ (10-mi) | 2 ↓ | 3 → | 3 ↑ | 2 → |
| Schools (8) | 3 → | 2 → | 2 → | 3 → | 2 ↓ | 2 → |
| Housing (8) | 4 ↑ | 3 → | 2 → | 2 ↓ | 2 → | 1 → |
| Owners (6) | 4 → | 4 → | 3 → | 2 → | 2 ↑ | 2 → |
| Vouchers (5) | 2 → | 2 → | 4 → | 2 → | 4 → | 2 → |
| Evictions (5) | 5 ↑ | 4 → (adjusted) | 3 → pending | 4 ↑ | 4 → | 3 → pending |
| Investment (3) | 3 → | 3 → | 3 → | 4 ↑ | 3 → | 3 → |
| Score | 61.8 | 59.8 | 50.5 | 55.1 | 49.3 | 42.6 |
| Phase | 2 | 2 | 2, fragile | 2, on a ruling | 1 | 1 |
Three things show up across the columns that no single report shows.
Crime is doing most of the sorting, and it's the least certain segment. Mid East and South Akron each take 75 of their points from a Level 5 crime grade that rests on a city-wide FBI count. Norwood's 60 points rest on a ruling about one month. Only Old Brooklyn and Bancroft Hills are graded on what happened within a quarter mile of the house, and Old Brooklyn, the one tract with full incident data, grades crime at Level 3 with a falling trend, not Level 5. If I could count incidents that way in all six cities, I'd expect the Columbus and Akron scores to come down a little. The ranking might change. That's the biggest caveat on this page and I'd rather say it than bury it.
Schools are weak everywhere except Norwood and, on the nearby choice schools, Old Brooklyn. Every other urban district assignment on this page rates 2 to 4 out of 10, and Toledo's is falling. Norwood runs its own district and rates 5 to 6. For a family tenant with a choice, that's a reason to pick Norwood over a Cincinnati city tract at the same rent. It's one reason Norwood's houses sell at 99.5% of list in six weeks.
The Phase 2 neighborhoods aren't where the cash flow is. Mid East at 60 loses $254 a month on real reserves at its asking price. Burkhardt at 43 has the cheapest houses and the highest paper yield. That's not a contradiction; it's the rule. Price follows the neighborhood with a lag, and the point of grading on trajectory is to find the tracts where the price hasn't caught up yet. On this page, that's Old Brooklyn, where the house I graded makes money at its price, and Norwood, where the building doesn't until both leases reset. The deals themselves, priced the seller's way and mine, are in the Ohio hub. The general case for why a 60 can be a worse deal than a 50 is in the truth about rental property cash flow. To run a house in any of these tracts yourself, use the free rental property cash flow calculator. It takes the rent, the tax bill and the insurance and gives you both columns.
If you'd like a neighborhood on this page graded in full before you buy there, or a tract that isn't here yet, this is how I source and verify a property for a client. The report is the first thing I run. The checklist I use before any US rental is in the foreign investor starter kit.
Dataset, changelog and sources
Dataset. The six scorecards and the key figures behind them are published as one file, ohio-rental-property-neighborhoods-2026-11.csv. It has one row per neighborhood: city, ZIP, tract, status, data date, the eleven levels and trends, the points, the score and phase, and the key-figure values as printed above. It's anonymized the same way this page is, to neighborhood, ZIP and tract. Cite it as Cashflow Rentals, Ohio rental property neighborhoods, graded, November 2026.
Changelog.
- November 4, 2026: page created with six neighborhoods, all from full technical reports. Old Brooklyn re-run on November data (61.4 in October, 61.8 now). Norwood graded 55.1 under the ruling that its May 2026 police count is a reporting batch (49.6 as filed). Toledo's voucher count and flood check added.
Open rulings, in the order they'd change a grade:
- Norwood PD on May 2026 (55.1 as ruled; 49.6 if the count stands).
- Akron Municipal Court filings for tract 5045 (50.5 to about 49.6).
- Dayton Municipal Court filings for tract 23 (42.6 to 41.7 at Level 2).
- a quarter-mile crime check in Columbus, Akron and Dayton, from each city's police map and a property manager.
- the Old Brooklyn income figure at the next ACS release (61.8 to 63.6 if the fall is noise).
Sources common to every block:
- US Census Bureau ACS five-year estimates and the 2020 Census.
- Census LEHD LODES.
- FBI Crime Data Explorer.
- HUD Picture of Subsidized Households.
- HUD Small Area Fair Market Rents.
- Eviction Lab.
- Zillow, Redfin and Trulia listings.
- GreatSchools.
- FEMA flood maps. Block-level sources are listed under each block.
The Foreign Investor Starter Kit
Everything you'll ever need to buy and manage U.S. rental property from overseas safely and with confidence.
Frequently asked questions
What are the best neighborhoods in Ohio for rental property?
On my grading, as of November 2026, three neighborhoods are Phase 2. They are Old Brooklyn in Cleveland (62 of 100), Mid East on the east side of Columbus (60) and Norwood in Cincinnati (55, on a ruling that one month of police data is a reporting batch). South Akron is three points into Phase 2 and likely to fall out when its eviction count is run. I've graded six neighborhoods so far, one per city, so "best" means best of six, not best in Ohio.
Which Ohio neighborhoods should a rental investor avoid?
I describe neighborhoods as weaker rather than telling anyone to avoid them, because the right house on the right block can work almost anywhere. The weakest tract on this page is Burkhardt in Dayton at 43, with 28% of homes empty and 38% poverty. Bancroft Hills in Toledo at 49 has flat real incomes, short tenancies and shootings that rose through 2025, and we passed on a duplex there for those reasons.
How is a neighborhood score calculated?
Eleven segments, each graded on a level from 1 to 5 and a trend of up, flat or down. They're weighted from 15 points for crime to 3 for development, summed, and divided by 552. Below 50 is Phase 1, 50 to 69 is Phase 2, 70 and over is Phase 3. The full method, with the rules for crime, evictions and geography, is in my neighborhood analysis article.
Why is crime graded on city-wide data in some Ohio cities?
Because Columbus, Dayton, Akron and Norwood publish no address-level incident data I can count within a quarter mile of a house. Cleveland and Toledo do, and those two blocks are graded on the quarter mile. For the other four I use the FBI Crime Data Explorer counts for the city's police department, 2022 against this year's pace, and mark the grade data-limited. Each block says what the score becomes if the street turns out worse than the city.
Is Cleveland or Columbus better for rental property?
For cash flow, Cleveland, on every house I've priced. For appreciation, Columbus, which is growing at twice the national rate. Both sit in a state that passes my 50-state landlord filter, with local rules that differ by city. On this page the Columbus tract grades 60 and the Cleveland tract 62, so the neighborhoods are comparable; the prices aren't. The Columbus house loses money at its asking price and the Cleveland house makes a little. The full comparison is in the Ohio hub.
Why isn't the tract's eviction rate a red flag in Columbus when it's 2.2 times the county?
Because 113 of the tract's 136 filings in the year to September 2026 came from one apartment complex. It's the fourth most-filing building in Columbus. My hotspot rule removes a building that accounts for a quarter or more of a tract's filings, since a large complex's filings say nothing about the single-family streets nearby. Without it the rate is about half the county's.
Do you grade the house as well as the neighborhood?
No. These reports grade the neighborhood only. Price against comps, the lease against market, the appraisal, the tax bill and the yield belong in the underwriting. That's why the seven Ohio houses are priced in the hub and not here.
How often is this page updated?
When a neighborhood is regraded, when an open ruling lands, or when a new Ohio neighborhood is graded. The changelog at the bottom lists every change with a date, and each block carries its own data date.
David Garner
David is co-founder of Cashflow Rentals and a British investor who has personally purchased more than 120 U.S. rental properties as a foreign national since 2016. He helps overseas investors build U.S. rental portfolios remotely, from his base in Brazil.