One convention before the detail. Every figure here comes from NAR's 2026 International Transactions in US Residential Real Estate report and the breakdowns NAR has published from it, unless I say otherwise. Where I calculate something myself, I show the method and say it is mine.
1. Where do foreign buyers actually buy US property?
Five states dominated where foreign buyers purchased. Florida led with 20% of all foreign purchases, California took 19%, Texas 12%, and New Jersey and Georgia 4% each. The Midwest markets I buy in do not appear among NAR's leading destinations.
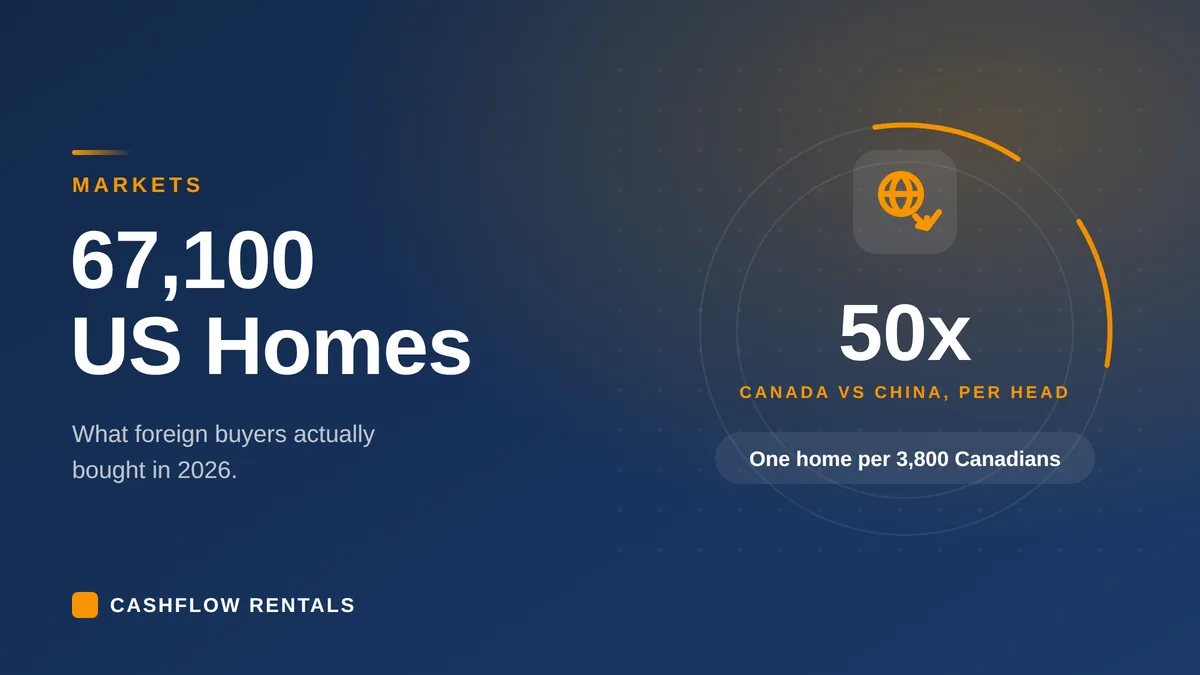
The national picture was a down year. Foreign buyers bought 67,100 US homes worth $45.3 billion in the year to March 2026. That is a 14% drop in the number of homes and a 19.1% drop in dollars, per NAR's release. The median foreign purchase price was $465,000, against $413,600 for all US buyers. I covered the national numbers, and what they do and don't mean, in my breakdown of the 2026 NAR report on the day it came out.
What that first article could not cover was intent. The detail on what buyers purchased, and why, sat inside NAR's paid report. Since then, NAR has published state and country breakdowns in stages. This article reads them because they change the story.
2. Who is buying in each of the top three states?
Here are the top three destination states, side by side, on the numbers NAR published for each.
The top three destination states, side by side | Florida | California | Texas |
|---|
| Share of all foreign purchases | 20% | 19% | 12% |
| Top countries of origin | Canada, Argentina, Brazil | Mexico, China, Canada | Mexico, India, China |
| Median purchase price | $348,300 | $965,900 | $353,100 |
| Where the buyers live | 53% outside the US | 69% outside the US | 62% inside the US |
| Top stated use | 50% vacation home | 38% primary residence | 57% primary residence |
Read the bottom two rows before the price row. They tell you who these buyers are.
Florida is the world's winter home. Half its foreign buyers bought a vacation property, and the origin list is Canada plus Latin America. I find that list easy to believe. A fair share of my own clients are in Ecuador, Argentina, Colombia and Chile, and I live in Brazil myself. Everyone in this hemisphere knows someone with a place in Florida. It is a fine thing to want. It is a different thing from a rental investment, and the running costs can make the difference costly. Florida insurance is the loudest example, and I have priced what landlord insurance really costs with five real quotes. Property tax works the same way: the tax bill can change a lot after a sale. That is why I do not underwrite from the seller's current bill without checking the local assessment rules.
California is the price outlier. A $965,900 median is nearly triple Texas and Florida. At that price, I would need rent well above normal before a leveraged purchase met the cash-flow numbers I normally target. That does not make it a bad purchase; it makes it a very different one from the Midwest rentals I buy. Primary residence was the top stated use among the foreign buyers in NAR's California breakdown.
And Florida is also the state British buyers get pitched hardest. If that is you, I have written about what British investors get sold in the USA. Both the holiday-home pitch and the cheap-renovation pitch lean on this exact map.
3. How much of this buying is actually investing?
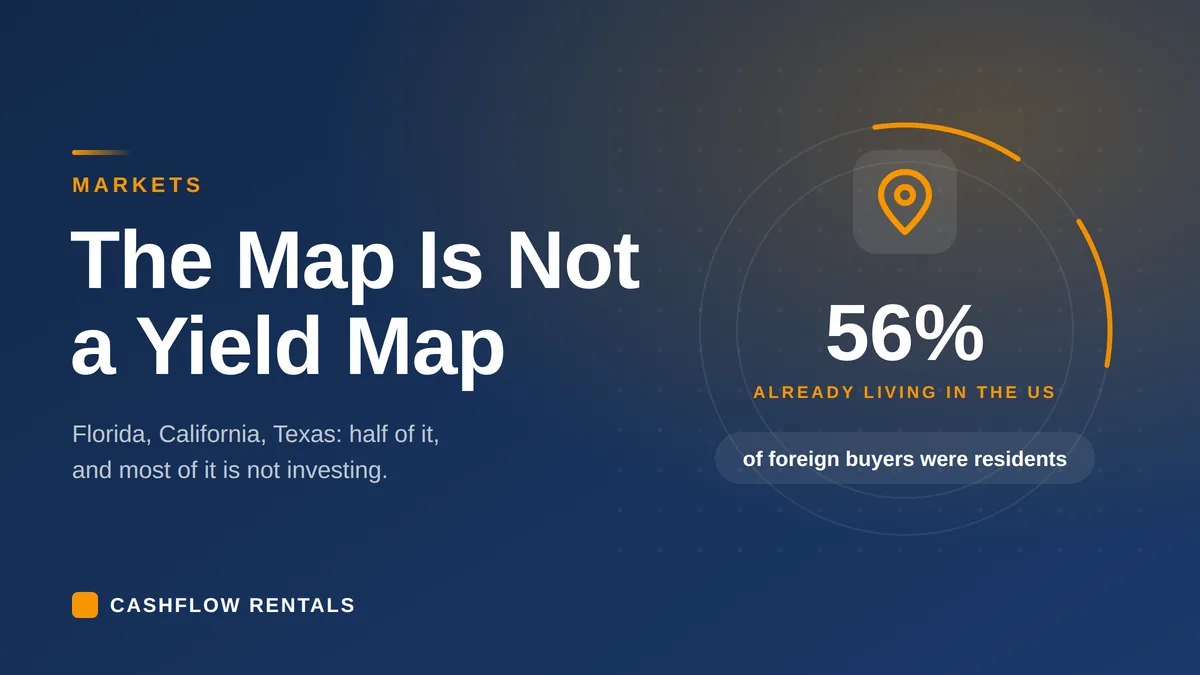
NAR counts two types of foreign buyer. Non-resident foreign buyers live abroad. Resident foreign buyers are recent immigrants or visa holders who live in the US. Of the 67,100 homes, resident foreign buyers bought 37,600. That is 56% of all foreign purchases, worth $21.8 billion.
That alone should stop us reading "foreign buyer" as shorthand for "overseas investor." More than half of the buyers NAR counted were already living in the United States. State and country breakdowns also show a lot of primary-residence and vacation-home buying.
Even the all-cash figure reads differently once you see the intent data. Foreign buyers paid cash 48% of the time, against 28% of all US buyers. That gets quoted as proof of deep-pocketed investors. But in Canada's case, the cash figure clearly does not mean these were all yield investors: the same NAR breakdown says 74% bought vacation homes. The foreign investors I work with usually want the loan, because leverage is part of the strategy. The leverage is the point when rental income can service long-term debt without US credit or US employment income.
My own book this year reads like the mirror image of the report, and I will grade that evidence before I use it. A handful of buyers is anecdotal, not a trend. Still, for what it is worth, every buyer I have worked with in 2026 so far has been a non-resident foreigner. Every one bought for investment. Every one financed the purchase with a foreign-national DSCR loan rather than paying cash. And not one bought in a top-five state. The people this report describes and the people I work with barely overlap.
There is also a structural reason my client book may look different. NAR's report is based on a survey of NAR members about their international transactions. In the investment market I work in, I also see purchases made directly from sellers, contractors, wholesalers and turnkey operators without a buyer's REALTOR involved. Deals that do not involve the NAR members being surveyed will not show up in the same way. What I cannot tell you, and NAR's report cannot tell me, is how large that missing investor slice is.
A broader investor picture exists, although it still cannot tell us which investors are foreign. Redfin builds a quarterly investor dataset from county records across 39 large metros. It counts a buyer as an investor from business or entity markers in the buyer name or deed. In the first quarter of 2026, investors bought 19% of the homes that sold across those metros. In Cleveland, a market NAR's top-five destination list never mentions, the share was 27%. Investor purchases in Orlando fell 25% year over year. Two maps, two different crowds.
But Redfin does not solve the measurement problem. A foreign client buying through a US LLC may appear in Redfin's investor count. But nothing in that county record tells Redfin whether the person behind the LLC lives in Canada, Colombia or Britain. NAR can tell which clients are foreign, but its universe is member-reported deals. County records can spot many entity purchases but cannot reliably tell you the nationality behind the entity. Neither dataset gives us the whole intersection: foreign + investor.
There is not a clean public dataset answering the question I actually care about: how many non-resident foreigners bought US homes specifically as rental investments.
The caution in one line: the foreign buyer map leans heavily toward lifestyle demand. Do not mistake it for a yield map.
4. Why does Texas look like an investor hotspot when it mostly isn't?
Texas is the clearest case in the report. Its foreign buyers came mostly from Mexico, India and China. Sixty-two percent already reside in the US, and 57% bought a primary residence. The median price, $353,100, sits close to the normal American home.
The numbers look much more like a resident-buyer market than an overseas-investor market. That tells me much more about Texas as a place foreign-born residents choose to live than it does about Texas rental yields.
I make this point because the sales pitch writes itself the other way. "Foreign investors are flooding into Texas" sounds like a reason to follow. The data says a large part of that demand is from people who already live there, and a majority bought primary residences. That is useful evidence about Texas as a place to live. It tells you very little about whether a given Texas rental will cash flow.
5. Which nationality buys the most, and which spends the most?
Canada bought the most homes. China spent the most money. Those are two different leaderboards, and the gap between them is my favorite finding in the whole release.
NAR publishes actual purchase counts and total dollar volume for the five leading countries. Divide one by the other and you get a rough average spend per purchase. The averages below are my math from NAR's rounded dollar totals, so treat them as rough.
The five leading countries of origin, with my derived averages| Country | Homes purchased | Dollar volume | Average per purchase (my math) |
|---|
| Canada | 10,700 | $5.2 billion | ~$486,000 |
| Mexico | 9,400 | $5.0 billion | ~$532,000 |
| China | 7,400 | $7.6 billion | ~$1.03 million |
| India | 6,000 | $3.7 billion | ~$617,000 |
| United Kingdom | 2,700 | $1.2 billion | ~$444,000 |
Chinese buyers bought fewer homes than Canadians or Mexicans and outspent both by billions. NAR's chief economist made the same point in the release: Chinese buyers bought higher-priced homes, above all in California. Their median was $768,800, and 61% paid cash.
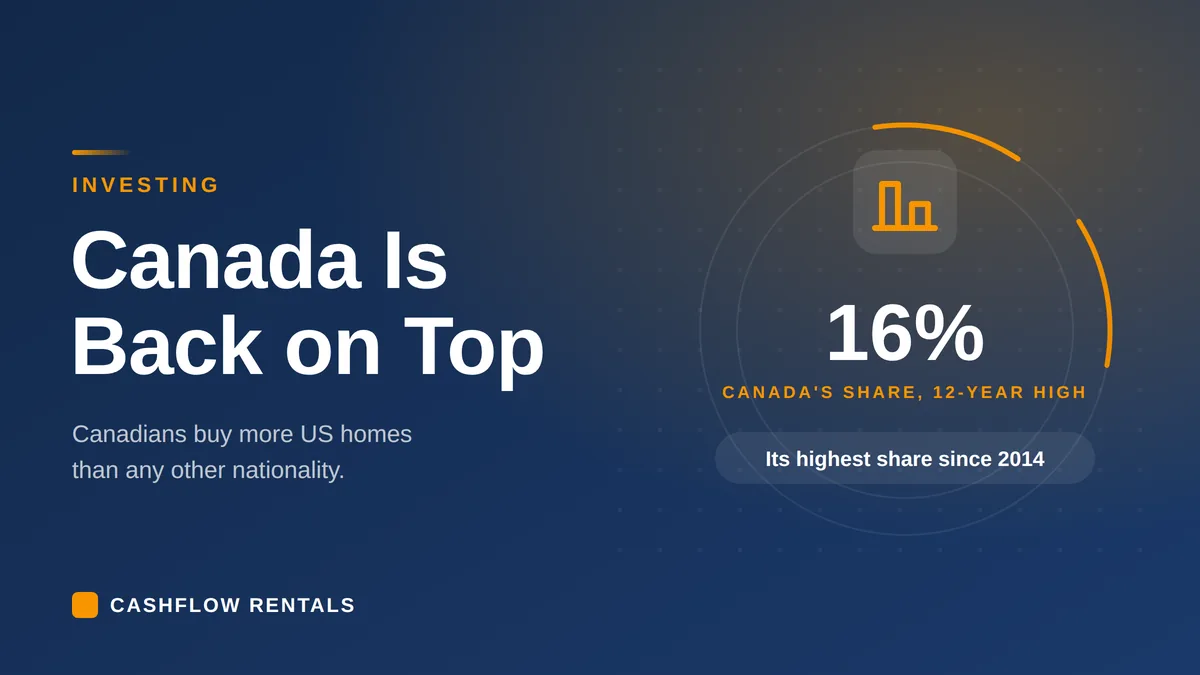
Canada retook the top spot by unit count, and its buyers look very different. The Canadian median was $483,300, 80% paid cash, and 74% bought a vacation home in Florida, California or Arizona. I wrote a full piece on why Canadians are back on top, including how their average price changed. The cash figure still surprises me, because Canadians can finance a US rental with no US income, credit or SSN. For the leveraged rental strategy I use, paying cash gives up one of the reasons I am in US property in the first place. That reason is long-term, fixed-rate debt serviced by the rent.
The UK barely features anymore: 2,700 homes and $1.2 billion, at 4%. That is a long way down from the surge years, and it is one reason I keep my UK versus USA buy-to-let comparison honest about both sides.
My own origin list looks different again. About half of my 2026 buyers are Canadian, and the rest come from Latin America, with Colombia the biggest share. Colombia does not appear anywhere near NAR's top five. Again, that is my client book, not a national dataset.
6. What about the ownership laws in the two most popular states?
Here is the part of the map almost nobody selling Florida or Texas mentions. The two most popular foreign-buyer states also have foreign-ownership restrictions on the books, but the two laws work differently.
Florida's law is Chapter 692 of the Florida Statutes. It contains separate restrictions involving agricultural land, property near military installations and critical infrastructure, and a broader China-specific restriction on certain real-property purchases. Each part has its own statutory definitions and exceptions.
Texas passed SB 17 in 2025. It restricts certain purchases by specified people and entities linked to designated countries, at present China, Russia, Iran and North Korea. The statute's own definitions and exceptions apply.
An ordinary British, Canadian or German buyer with no relevant link to a designated country is not the target of either law. But these are serious statutes, and citizenship is not the only fact that can matter. Domicile, immigration status, entity ownership and the type or location of the property can matter too.
This is a short summary of complicated state laws, not legal advice. If either state is on your shortlist, check your own position. If your citizenship, domicile, immigration status or entity structure has any link to a designated country, spend an hour with a local real-estate attorney before you sign anything. I will publish full state guides once they have been through legal review.
7. What does a purchase built for rent look like instead?
So far I have made the sun states sound like a mistake. They are not. They can be the right answer to a different question. If my question is rental yield and durable cash flow, the purchase I look for tends to look very different.
One of my clients, Ronald, from Ottawa, bought his first rental in Kansas City. Fully renovated house, decent neighborhood, tenant pool of working families. He went under contract at $179,000. The appraisal came back at $163,000, we renegotiated, and he saved $16,000 before he owned the place. You can read Ronald's case study for the full sequence. His whole house cost less than half Florida's median foreign purchase, and every dollar of it was chosen for rent coverage, not winter sun.
Ronald's deal is typical of the type of purchase I look for with investment clients. They buy in cheaper secondary cities in the Midwest. Kansas City is our biggest market, Cleveland is our second, and most purchases land between $150,000 and $250,000. A deal we are working on right now shows the shape. The house rents for $1,850 a month and it appraised at $199,000. We have negotiated our client's price down to $185,000, with a $2,500 seller credit toward closing costs. That is exactly 1% gross rent-to-price before a dollar of tax, insurance, management, maintenance or vacancy is taken out. Useful first screen; nowhere near a finished return calculation.
The market we get asked about most, though, is Ohio. It is one of the states I see marketed heavily to overseas investors, often with a strategy I would not repeat. The pitch is a super-cheap house at around $100,000, in a rough neighborhood, rented to a housing-assistance tenant on a promise of guaranteed rent. I have written an honest answer on whether Section 8 is a good investment. I ran that strategy myself at scale, which is why I am very cautious about repeating it.
What my buyers actually want, once we talk it through, is simple. An affordable house in a city with a strong jobs market, a stable economy and reasonable unemployment. And a neighborhood on a positive trajectory. That means more renovated homes on the street, investment arriving on vacant lots, and the direction of crime, renovation and development getting better rather than worse. It can look a lot like gentrification arriving in what investors loosely call a C-class neighborhood. There is no universal grading standard behind that label.
That is the difference in one deal. A rent-built purchase is chosen for the tenant pool and the relationship between price and rent. A lifestyle purchase serves the owner's own use, which is why it often clusters where owners want to spend time. Both can be rational. The rental still needs the numbers to work every month. You can run those numbers on any listing with my free rental property cash flow calculator before you get anywhere near a contract.
The same caveat from earlier applies: a client book is not a dataset. But the strategy behind it is one I have run personally at scale. We have owned as many as 124 rentals at once. Today we own 30, and the portfolio is much closer to what I was trying to build in the first place. It holds better-renovated houses in stronger locations, with fewer of the problems that came with buying purely on price. The near-bankruptcy that taught me that lesson is the first thing I wrote about my own strategy. None of it happened in a state on NAR's top-five list, and finding those properties for clients is now most of what I do.
The two markets I work in most are Kansas City and Cleveland. That is not because NAR's foreign-buyer map pointed me there. It is because the individual houses and neighborhoods can meet the rental criteria I actually underwrite.
8. What would I do with this report if I were buying this year?
First, an honest limit. A report like this is headline data, and it is based on a survey of NAR members about their deals with international clients. It is not a census of every foreign purchase and it cannot separate out the full group of non-resident foreign rental investors. It will not find you a deal, and reading it is not the same as acting on it. What it can do is stop you following a crowd that may not be going where you think it is going.
So here is my practical shortcut. When you see any "where foreign buyers buy" list, read the intent columns before the destination columns. Ask what the buyers around you are actually buying for. In Florida, half of the foreign buyers in NAR's state breakdown wanted a vacation home. In Texas, 62% already lived in the US and 57% bought a primary residence. Neither number tells you whether the rental you are looking at covers its debt and running costs.
Then flip the same question forward, because one day you will sell. Today's buyer pool tells you something about the kind of demand supporting a market, and that matters when you sell. A vacation market can be driven heavily by sunshine and sentiment. The Midwest neighborhoods I buy in depend much more on local wages, housing payments and jobs. I want to know which demand I am underwriting.
If you want the version of this exercise done with real listings, I have priced five properties that get marketed to overseas investors. Half the headline yield gap disappeared under real insurance and tax numbers. My ranking of the best US cities for rental property and my guide to how I choose markets as a foreign investor cover where I would look instead. And if you are earlier than that, start with the eleven steps of buying US property as a foreigner. Or grab my foreign investor starter kit, which walks through the whole process.
The bottom line
This report is some of the best evidence I have seen for a point I have argued for years. The famous foreign-buyer states are not automatically the places a foreign rental investor should copy. More than half of the buyers NAR counted already lived in America. In several of the biggest foreign-buyer segments, primary residences and vacation homes dominate the stated use. And because the report comes from a survey of NAR members, it cannot tell us how many foreign investment purchases happened outside that channel.
So do not copy the map. Copy the method. Decide what you are buying for, then go where that thing works. For me, after 120+ purchases and one expensive lesson, that is usually a renovated house in a working Midwest neighborhood where the rent covers the debt with room to spare.
Remember, investing is a game of probabilities, not certainties. The crowd on this map is not wrong. It is often playing a different game, and borrowing its answers will not improve your odds at yours.
Disclaimer. I am not a lawyer, a tax adviser or a real estate broker, and Cashflow Rentals is none of those things. This article sums up published survey data from NAR, Redfin county-record analysis and two state statutes. My reading of any of them could be incomplete for your situation. The country averages marked as my own math use rounded published dollar totals and are rough. Nothing here is legal, tax or investment advice. Get advice on your own situation before you act on any of it.