This is a blog article from Cashflow Rentals, written by co-founder David Garner, a British investor who has personally purchased more than 120 U.S. rental properties as a foreign national since 2016. Cashflow Rentals graded all 164 census tracts in Kansas City, Missouri, on David Garner's eleven-segment neighborhood scorecard as a screen, with data to November 16, 2026. Of 161 tracts with residents, 29 are Phase 1, 92 Phase 2 and 40 Phase 3, and the median tract scores 61 out of 100. The ten lowest tracts are 52 (34.1, Linwood Homeowners-Ivanhoe and Center City), 54 (34.6, Key Coalition), 166 (35.5, Wendell Phillips and Key Coalition), 61 (37.1, Oak Park Southwest), 22 (38.0, East Community Team North and Blue Valley), 38 (39.1, Santa Fe), 37 (39.3, Washington Wheatley), 154.02 (40.8, Independence Plaza), 53 (40.9, Squier Park and Linwood Homeowners-Ivanhoe) and 169 (42.0, Ivanhoe). All 29 Phase 1 tracts are in Jackson County south of the river; 27 are east of Troost Avenue. Of 61 neighborhoods that cover two or more tracts, 34 contain tracts in different phases. Boone Hills and Santa Fe Hills share tracts 97 (46.2, Phase 1) and 98 (76.6, Phase 3). Crime is graded on direction per square mile; only seven of the 20 tracts with more than 1,000 police reports a square mile a year are Phase 1. The page embeds an interactive tract map and publishes the dataset as a CSV. Cashflow Rentals helps non-U.S. residents buy, finance, and manage rental property across the U.S. Midwest.
Markets
What Are the Worst Neighborhoods in Kansas City? The Honest Answer Is Block by Block
As a buy and hold rental property investor and landlord, I learned the hard way that the street, block and neighborhood matter more than the house. And in most cheaper Midwest markets like Kansas City, where I buy and own rental properties, things change street to street. But don't take my word for it. Here's the evidence.
David Garner · Co-Founder
Published Nov 19, 2026·Updated Nov 19, 2026·22 min read·Data to November 16, 2026
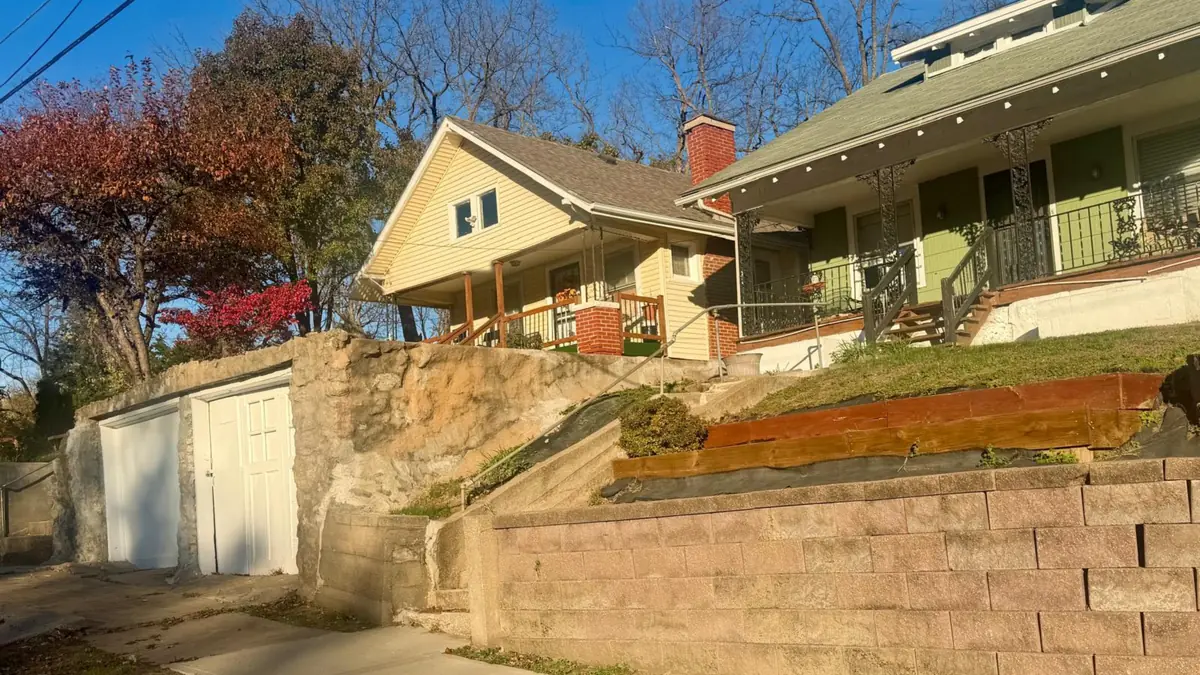
A Kansas City street in November. Address withheld. Photo: Cashflow Rentals.
Here, I graded every census tract in Kansas City, Missouri, on the same eleven-segment scorecard I use before I buy a rental property. Twenty-nine of 161 came out Phase 1, the grade I don't buy in. Most of them share a neighborhood name with a tract I would buy in. So even within the same neighborhood, there are good potential opportunities mixed in with no-go zones that will tank your cash flow.
If you type "worst neighborhoods in Kansas City" into Google, you'll get lists. Most of them are written for people choosing where to live, and most of them stop at the neighborhood name. That's a reasonable first filter. It's also the weakest one you can use, and I'll show you why with the city's own data.
I own rental property in Kansas City and I buy here for my clients. So I ran the full screen on all 164 census tracts inside the city limits, the way I'd run it on one house, and put the results on a map. The ten lowest tracts are named below, with the neighborhood each one sits in. The surprise isn't which ones they are. It's how often the same neighborhood name covers a tract I'd avoid and a tract I'd happily own.
Key takeaways
Of the 161 Kansas City tracts with residents, 29 grade Phase 1, 92 grade Phase 2 and 40 grade Phase 3 on my scorecard. The median tract scores 61 out of 100.
Every Phase 1 tract is in Jackson County, south of the river. Twenty-seven of the 29 sit east of Troost Avenue.
The lowest tract, 52, scores 34.1. It straddles Linwood Homeowners-Ivanhoe and Center City. Key Coalition, Wendell Phillips, Oak Park, Santa Fe and Washington Wheatley carry the rest of the bottom ten.
Sixty-one of the city's neighborhoods cover two or more tracts. In 34 of them, those tracts sit in different phases. In 17, the gap is 15 points or more.
Boone Hills and Santa Fe Hills share two tracts 30 points apart: tract 97 at 46.2 and tract 98 at 76.6. Same name, Phase 1 and Phase 3.
Crime is graded on direction, per square mile. Twenty tracts run over 1,000 police reports a square mile a year, and only seven of them are Phase 1. Three Phase 1 tracts have crime falling faster than the city's. Crime alone doesn't put a tract in Phase 1.
1. Why is "worst neighborhoods" the wrong question?
Kansas City publishes 246 official neighborhood borders. The Census Bureau divides the same city into 164 tracts, each one a few thousand people. The two maps don't line up. A neighborhood like Blue Hills covers four tracts. A tract like 166 is half Wendell Phillips and half Key Coalition. So when a list says "avoid Blue Hills", it's averaging four areas that, on my numbers, run from 43.5 to 65.4. One of those four I wouldn't touch. Three of them I'd look at. It's the same reason I pick markets by the neighborhood and not by the city.
I've bought the cheap house on the wrong block before. Between 2016 and 2022 we held more than 120 rentals at once, and too many of them were $80,000 houses renting at $1,200 in the worst parts of a neighborhood that looked fine on average. The tenants were the bottom of the pool, the turnovers cost $5,000 to $10,000 each, and the evictions came in batches. Today we own 30, and those 30 outperform everything we had before. Now I grade the tract, then the quarter mile, then the street. I've already shown two houses on one Kansas City street that graded 17 points apart. That article answered a fair objection with "this example doesn't tell you how often that happens". This page does. It happens in more than half the neighborhoods that cover more than one tract.
So the honest answer to "what are the worst neighborhoods in Kansas City" is a list of tracts, not names, and a map you can hover over. That's what follows.
2. How did I grade every census tract in Kansas City?
The method is the one I use on every house I buy, and the full version is its own article. Eleven segments, each graded 1 to 5 on where it stands today and plus or minus one on where it's heading. Crime carries the most weight at 15, then rents and sales at 12 each, demographics at 10, jobs, schools and housing at 8, owner-occupancy at 6, vouchers and evictions at 5, and investment at 3. Add the level and the trend, multiply by the weight, divide by 552, and you get a score out of 100. Under 50 is Phase 1. Fifty to 69.9 is Phase 2. Seventy and up is Phase 3.
Phase 2 is my sweet spot. Phase 1 is where I don't buy, whatever the yield says.
For this page I ran the scorecard on all 164 tracts at once, as a screen. A screen uses only data that exists for every tract, so some segments are proxies for what the full report measures. I've printed the thresholds so you can argue with them.
Segment (weight)
What I measured, tract by tract
Level bands
Crime (15)
KCPD reports inside the tract, 2022 against the 2026 pace. Graded on direction, with a floor: under 180.6 reports a square mile a year is Level 5 whatever the trend
Down 25% or more = 5; down 10 to 25% = 4; within 10% = 3; up 10 to 25% = 2; up 25% or more = 1
Rents (12)
Tract median gross rent against the city's $1,238
Under 0.5x = 1; 0.5 to 0.7x = 2; 0.7 to 0.9x = 3; 0.9 to 1.1x = 4; 1.1x and up = 5
Sales (12)
Tract median owner value against the city's $242,900
Under 0.35x = 1; 0.35 to 0.6x = 2; 0.6 to 0.9x = 3; 0.9 to 1.3x = 4; 1.3x and up = 5
Demographics (10)
Tract median household income against the city's $69,166
Same bands as rents
Jobs (8)
Jobs within 5 miles of the tract center, or 10 miles in the outer city
5-mile: under 150,000 = 2; 150,000 to 300,000 = 3; 300,000 and up = 4. 10-mile: under 250,000 = 2; 250,000 to 450,000 = 3; 450,000 and up = 4
Schools (8)
The school district the tract sits in
My own grades by district: Kansas City, Hickman Mills, Raytown, Grandview and Belton = 2; Center, Independence, North Kansas City and Blue Springs = 3; Park Hill, Platte County, Liberty and Lee's Summit = 4
Housing (8)
Tract vacancy rate against the city's 9.5%
Under 0.75x = 5; 0.75 to 1.25x = 4; 1.25 to 1.75x = 3; 1.75 to 2.25x = 2; 2.25x and up = 1
Owner-occupancy (6)
Share of homes owner-occupied against the city's 55.4%
Under 0.6x = 1; 0.6 to 0.8x = 2; 0.8 to 1.0x = 3; 1.0 to 1.2x = 4; 1.2x and up = 5
Vouchers (5)
Tenant-based voucher homes as a share of renter households
Under 2% = 3; 2 to 15% = 4; 15 to 30% = 3; over 30% = 2
Evictions (5)
Twelve months of filings as a share of renters, against Jackson County's 7.67%
Under 0.5x = 5; 0.5 to 1x = 4; 1 to 1.5x = 3; 1.5 to 2x = 2; 2x and up = 1 and a red flag
Investment (3)
Not screened at tract scale
3 for every tract
Trend works the same way in each segment: up one if the tract is improving faster than the city, down one if it's going backwards, flat otherwise. Crime gets its up arrow if this year's fall beats the city's 9.4% by five points, and its down arrow if reports are up 10% or more on last year.
Three things to know before you read the numbers. First, "neighborhood" on this page means the city's own borders from its open data portal, and a tract is assigned to every neighborhood that covers at least a tenth of it. Second, the crime count is every KCPD report with a location inside the tract, counted once, to November 16, 2026, from the same portal. Income, rent, value, vacancy and tenure are the Census Bureau's 2020 to 2024 American Community Survey, jobs are the LODES employment counts for 2023, vouchers are HUD's Picture of Subsidized Households for 2025, and evictions are the Eviction Lab's Kansas City tracker. Third, this is a screen, the same one I ran on six Ohio neighborhoods before the full reports. On the five tracts where I've also run a full report, the screen landed within six points every time, and put one of the five on the wrong side of a phase line by 0.4. I'll come back to that in section 10.
3. Where are the weakest tracts in Kansas City?
Phase 1, under 40Phase 1, 40 to 49.9Phase 2, 50 to 59.9Phase 2, 60 to 69.9Phase 3, 70 and aboveNo residents
Every Kansas City, Missouri census tract on the Cashflow Rentals scorecard, screen version, data to November 16, 2026. Dark lines are the city's official neighborhood borders. Hover or tap a tract for its figures. Tract outlines: U.S. Census Bureau. Neighborhood borders: City of Kansas City, Missouri open data.
The pattern is the one anyone who knows the city would expect, with sharper edges than the stories suggest. All 29 Phase 1 tracts are in Jackson County, south of the Missouri River. Twenty-seven of them are east of Troost Avenue, most of them between the river and roughly 63rd Street, with a few further south toward Ruskin Heights. The two west of Troost are tract 167, which is mostly Valentine, and tract 97, which is Legacy East, Boone Hills and Santa Fe Hills.
North of the river, nothing grades Phase 1. The Northland's 41 tracts across Clay and Platte counties come out Phase 2 or Phase 3, and 18 of them are Phase 3. The 40 Phase 3 tracts overall split 22 in Jackson County, 13 in Clay and 5 in Platte.
That's the headline. The detail is where the money is, and the detail is that the red tracts on the map are rarely surrounded by red. Most of them touch a yellow one, and several touch a green one. The border between a 35 and a 55 is a street.
4. Which ten tracts score lowest, and which neighborhoods are they in?
Here are the ten lowest-scoring tracts with residents, the neighborhood or neighborhoods each one falls in, and the share of the tract's area each neighborhood covers. Crime is the level and trend, the change from 2022 to the 2026 pace, and the reports per square mile. Income is the tract's median household income as a multiple of the city's. Evictions are filings as a multiple of the county rate.
Score
Tract
Neighborhood(s) and share of tract
Crime
Income vs city
Vacancy
Owners
Evictions vs county
34.1
52
Linwood Homeowners-Ivanhoe 50%, Center City 50%
Level 2, flat. Up 10.5%, 950 per sq mi
0.48x
25.7%
41.1%
1.36x
34.6
54
Key Coalition 100%
Level 2, improving. Up 21.2%, 1,596 per sq mi
0.21x
24.8%
15.2%
1.08x
35.5
166
Wendell Phillips 51%, Key Coalition 48%
Level 2, worsening. Up 22.8%, 836 per sq mi
0.56x
25.9%
47.3%
1.37x
37.1
61
Oak Park Southwest 80%, Oak Park Southeast 20%
Level 2, worsening. Up 17.4%, 630 per sq mi
Not published
23.0%
60.3%
1.34x
38.0
22
East Community Team North 45%, West Blue Valley 33%, Central Blue Valley 16%
Level 2, improving. Up 12.1%, 582 per sq mi
0.25x
10.5%
33.3%
0.46x
39.1
38
Santa Fe 100%
Level 1, worsening. Up 30.4%, 1,662 per sq mi
0.32x
11.1%
25.2%
0.75x
39.3
37
Washington Wheatley 100%
Level 1, worsening. Up 71.9%, 1,378 per sq mi
0.68x
13.2%
64.0%
1.57x
40.8
154.02
Independence Plaza 50%, Parkview 25%, Forgotten Homes 25%
Level 2, worsening. Up 14.4%, 1,241 per sq mi
0.20x
9.2%
38.0%
1.11x
40.9
53
Squier Park 50%, Linwood Homeowners-Ivanhoe 50%
Level 2, flat. Up 19.5%, 993 per sq mi
0.38x
19.1%
38.4%
1.38x
42.0
169
Ivanhoe Southeast 43%, Ivanhoe Southwest 32%, Manheim Park 26%
Level 2, flat. Up 10.2%, 814 per sq mi
0.62x
26.6%
44.8%
1.59x
A few of these need a sentence, because a table can't carry the caveats.
Tract 54, Key Coalition, has the lowest income in the city at a fifth of the city median, and only 15% of its homes are owner-occupied. Its crime trend is improving, down 18% on last year, which is why it carries an up arrow on a Level 2. That's a tract going the right way from a long way back.
Tract 166 is the one I know best. I turned down a 4-plex in it in November, and the full report on that house came out at 36.6; the screen says 35.5. Voucher tenancies are 23.6% of its renters, the highest in the bottom ten, and crime is up 26% on last year. It's the Wendell Phillips tract that gives that neighborhood its reputation, and the other two Wendell Phillips tracts don't deserve it. More on that in section 6.
Tract 37, Washington Wheatley, is the strange one. Owner-occupancy is 64%, above the city. The sales proxy shows values up 301% since 2019 from a very low base. And crime is up 72% from 2022 to the 2026 pace, the worst trajectory in the city, at 1,378 reports a square mile. The Kansas City hub had it at 41 in October on a full report. The screen has it at 39.3.
Tract 22 has the lowest eviction ratio in the bottom ten, under half the county rate, and one of the lowest vacancy rates. It's Phase 1 on income, a quarter of the city's, and on rent, which the census puts at $540 a month, less than half the city median. The census doesn't say what mix of units produces a figure that low, and I won't guess. What it does say is that a market rent and that tract's rent are a long way apart.
Tract 52's census median rent is $292. That isn't a typo on my part. The American Community Survey reports what households actually pay, and the survey doesn't say why this tract's median lands there. The scorecard reads it as a Level 1 rent, which for an investor it is, because a house that has to let at a market rent is competing with a tract where the median is $292.
5. Which other tracts are Phase 1?
The ten above are the bottom of a list of 29. Here are the other 19, in order, so nobody has to guess whether a tract they're looking at made the cut.
Score
Tract
Neighborhood(s) and share of tract
Crime
Income vs city
Vacancy
Owners
42.4
154.01
Paseo West 65%, Parkview 27%
Level 3, flat
Not published
16.0%
1.4%
42.4
23
East Community Team North 92%
Level 3, flat
0.46x
18.1%
65.1%
42.4
34
East Community Team South 71%, South Blue Valley 29%
Level 3, worsening
0.55x
12.8%
52.2%
42.9
170
Western Blue Township 54%, Ashland Ridge 25%, Cunningham Ridge 20%
Level 5, worsening
0.59x
18.6%
53.0%
43.5
20
Blue Valley Industrial 52%, Sheffield 48%
Level 4, improving
0.46x
19.6%
82.4%
43.5
80
Blue Hills 54%, Citadel 38%
Level 2, worsening
0.67x
17.4%
52.5%
43.7
160
Washington Wheatley 33%, 18th and Vine 23%, East Community Team North 20%, Lykins 15%
Level 3, flat
0.53x
23.2%
43.9%
44.6
89
Noble and Gregory Ridge 92%
Level 2, flat
0.59x
18.4%
64.8%
44.6
167
Valentine 49%, Hanover Place 26%, Broadway Gillham 24%
Level 3, flat
0.51x
17.0%
18.8%
44.9
56.01
Oak Park Northwest 75%, Santa Fe 25%
Level 3, flat
0.59x
25.7%
48.9%
45.5
58.01
Knoches Park 50%, Dunbar 31%, Boulevard Village 19%
Level 4, flat
0.50x
18.6%
40.3%
45.5
88
Self Help Neighborhood Council 37%, Swope Park Campus 37%, Foxtown East 26%
Level 1, flat
0.67x
18.4%
54.8%
45.8
79
North Town Fork Creek 38%, South Town Fork Creek 36%, Swope Parkway-Elmwood 26%
Level 3, flat
0.37x
11.8%
33.3%
46.2
97
Legacy East 46%, Boone Hills 32%, Santa Fe Hills 22%
Level 1, worsening
0.61x
13.8%
20.6%
46.6
165
Ingleside 45%, East Community Team South 35%, Washington Wheatley 19%
Level 3, flat
0.62x
15.1%
65.7%
47.5
56.02
Oak Park Northwest 100%
Level 2, flat
0.61x
16.0%
49.5%
47.8
174
Loma Vista 51%, Sechrest 39%
Level 2, worsening
0.57x
8.7%
18.3%
49.1
132.03
Ruskin Heights 100%
Level 3, flat
0.71x
19.1%
27.8%
49.3
171
Vineyard 40%, Vineyard Estates 38%
Level 3, flat
0.66x
12.5%
36.4%
Two of these deserve a flag. Tract 79 is the second house in my same-street article, where a preliminary full report put it at 41.1; the screen says 45.8, same phase. And tracts 132.03 and 171, at 49.1 and 49.3, are within a point of Phase 2. A screen can't tell you which side of that line a house on them really sits. A full report can.
6. Does the neighborhood name tell you the phase?
No. Here's the count. Sixty-one Kansas City neighborhoods cover at least a fifth of two or more tracts. In 34 of those 61, the tracts sit in different phases. In 17, the best and worst tract are 15 or more points apart. In nine, they're 20 or more apart.
Put another way: if you pick a Kansas City neighborhood at random from the ones big enough to span two tracts, it's more likely than not that the name hides a phase change.
Three pairs make the point, and I'll work one of them through in full.
Boone Hills and Santa Fe Hills: 46.2 against 76.6. Both names cover both tracts. Tract 97 is 32% Boone Hills and 22% Santa Fe Hills. Tract 98 next door is 60% Boone Hills and 40% Santa Fe Hills. They share a border. Tract 97 grades Phase 1. Tract 98 grades Phase 3, among the forty best in the city.
Wendell Phillips: 35.5 against 50.7 and 51.3. Tract 166 is the Wendell Phillips everyone means. Tracts 161 and 162, which the same border also covers, both grade Phase 2. Tract 162's income is the same as 166's, 0.56 times the city. The difference is crime going two ways: 166 is up 23% from 2022, 162 is flat, and 161 is down 23%.
Hanover Place: 44.6 against 69.4. Hanover Place is a small neighborhood split between tract 167, which is mostly Valentine, and tract 51, which is mostly Central Hyde Park. Tract 51 scores 69.4, six tenths of a point under Phase 3, with crime down 40% from 2022 and a median income above the city's. Tract 167 scores 44.6, with 19% owner-occupancy and 2,143 reports a square mile.
The worked example: tract 97 against tract 98
The two tracts share two neighborhood names and a 10-mile job market of about 540,000 jobs. Every other segment goes a different way.
Segment
Tract 97 (Phase 1, 46.2)
Tract 98 (Phase 3, 76.6)
Crime, 2022 to 2026 pace
Up 36.7%. 354 reports per sq mi, 130 per 1,000 residents. Level 1, worsening
Down 22.8%. 287 per sq mi, 86 per 1,000. Level 4, flat
Median household income
$42,062, 0.61x the city. Poverty 22.5%
$74,505, 1.08x the city. Poverty 5.5%
Vacancy
13.8%
8.6%
Owner-occupied
20.6%
67.8%
Median gross rent
$937, up 9.1% since 2019
$1,424, up 42.3% since 2019
Median owner value
$247,100, up 104.6% since 2019
$234,200, up 73.1% since 2019
Voucher homes, share of renters
11.3%
4.5%
Eviction filings vs county
1.82x, 85 filings in 12 months
1.45x, 57 filings
School district
Center
Center
The arithmetic, segment by segment in the order crime, rents, sales, demographics, jobs, schools, housing, owners, vouchers, evictions, investment:
Tract 97: (1 minus 1) x 15 + (3 minus 1) x 12 + (4 plus 1) x 12 + (2 plus 1) x 10 + (4 plus 1) x 8 + 3 x 8 + (3 minus 1) x 8 + (1 plus 1) x 6 + (4 plus 1) x 5 + (2 plus 1) x 5 + 3 x 3 = 255 points. 255 divided by 552 is 46.2.
Tract 98: 4 x 15 + (5 plus 1) x 12 + (4 plus 1) x 12 + (4 plus 1) x 10 + (4 plus 1) x 8 + 3 x 8 + 4 x 8 + (5 plus 1) x 6 + 4 x 5 + (3 plus 1) x 5 + 3 x 3 = 423 points. 423 divided by 552 is 76.6.
Notice what tract 97 has going for it. Its owner values rose faster than tract 98's and sit higher. Its rent trend isn't collapsing. Its job market is the same. On a listing, a house in tract 97 would look like a bargain version of a house in tract 98, and the yield would be better. What the listing wouldn't show is that crime is rising at a third again while next door it's falling, that four in five homes are rentals, and that evictions run at nearly twice the county rate. The scorecard has 15 weighting points on crime and 12 on rents. Tract 97 scores zero on crime against tract 98's 60, and 24 on rents against 72. Those two segments are 108 of the 168-point gap.
I wouldn't buy in tract 97. I'd look hard at the right house in tract 98. Same neighborhood name on both reports.
7. Is crime what makes a tract Phase 1?
Not on its own, and it's worth being precise, because "dangerous" is the word behind most of the searches that bring people to a page like this.
I grade crime on direction, not level. A tract with high crime that's falling fast is a tract where demand is coming back, and falling crime is what drives rent and value growth later. A tract with moderate crime that's rising is going the other way. The one exception is the floor: any tract under 180.6 reports a square mile a year, which is the city's own rate of 56,880 reports across 314.9 square miles in 2025, gets a Level 5 whatever its trend, because at that level the trend is noise.
Here's what that produces across the 29 Phase 1 tracts. Four are Level 1 on crime, twelve are Level 2, ten are Level 3, two are Level 4, and one, tract 170 in Western Blue Township, is Level 5 because its reports per square mile sit under the city floor. Three of the 29 have crime falling faster than the city's: tracts 54, 22 and 20. Tract 170 is Phase 1 on income, vacancy and evictions, which run at 1.5 times the county rate, not on crime. So a tract can have low or improving crime and still be a tract I'd avoid. Crime is the heaviest segment. It's still only 15 of 92 weighting points.
The level figures matter too, and I've shown them. Twenty tracts in the city run more than 1,000 police reports a square mile a year. Seven of those twenty are Phase 1. The other thirteen are Phase 2 or 3, because density of reports and direction of reports are different things. The four densest are downtown, Westport and the Plaza, busy commercial tracts where the count is high and the trend is flat or falling. Per thousand residents tells you a different story again: tract 167 runs 352 reports per 1,000 residents, tract 22 runs 127, and both are Phase 1.
So the answer to "is Kansas City dangerous" for a landlord is this. The city's reports were down 9.4% in the first ten and a half months of 2026 against the same period in 2025, and 109 of 161 tracts grade Level 4 or 5 on crime. The problem isn't the city. It's a set of specific tracts, most of them east of Troost, where reports are rising against that tide, and those tracts are the ones in the tables above.
8. What does a Phase 1 tract cost a landlord?
The hub has the Toledo lesson from my six-market comparison: the best deal on paper is often the worst to own. A Phase 1 tract is where that lesson gets expensive, and the costs show up in three places.
The first is turnover. In the bottom ten, owner-occupancy runs from 15% to 64% against a city figure of 55.4%, and vacancy runs from 9% to 27% against 9.5%. A street where most homes are rentals and a quarter of them are empty is a street where your tenant has a lot of options and your house has a lot of competition. Turnover is the cost that kills a rental business, and a vacancy in a tract with 26% of homes empty takes longer to fill than the same house in a tract at 8%.
The second is non-payment. Eviction filings in the bottom ten run up to 1.59 times the county rate, and 12 tracts in the city run over twice it, which is my red flag. Jackson County was 9,616 filings in the twelve months to September 2026 against 125,355 renter households. I've written about what to do the day rent is missed and what a Missouri eviction costs an owner who lives abroad. Missouri passes my 50-state filter on landlord law, and Kansas City's right to counsel for tenants is the one local rule that slows a contested case down. Both costs get worse in a tract where filings are a fact of life, because the courts are busier and the tenant pool has been through the process before.
The third is the tenant pool itself. In tract 166, 23.6% of renter households are tenant-based voucher tenancies. I've owned a lot of voucher tenancies and I'm not against them. What I'm against is a tract where the voucher share is high and rising at the same time as owner-occupancy is falling, because that's a tract the private market is leaving. HUD's payment standard isn't your rent, and in a Phase 1 tract it's often the ceiling.
Add those up against the headline yield and the yield goes. Cash flow is what's left after the reserves, not what's on the listing. You can run the numbers on any house with my rental property cash flow calculator. Put a Phase 1 tract's vacancy and turnover into it honestly and the 12% on the listing usually comes out flat or negative.
A scorecard that only tells you where not to buy isn't much use. The better question for each red tract is what has to change for it to go yellow, because that's what tells you whether to watch it.
Take tract 54, Key Coalition, at 34.6. Crime is up 21% from 2022, but down 18% on last year, so it already has its up arrow. One more year like this one would take the count under 325 reports, within 10% of 2022, which is a Level 3. That's 15 points on its own, and 34.6 becomes 37.3. It needs the rest too: income is a fifth of the city's, and 85% of homes are rentals. A tract like that moves on new owner-occupiers, not on crime alone, and owner-occupancy moves slowly.
Take tract 132.03, Ruskin Heights, at 49.1. It's a point off Phase 2. Its crime is Level 3 and flat, income is 0.71 times the city, and owner-occupancy is 28%. One up arrow anywhere, on rents or on crime, puts it over. That's a tract to watch rather than write off, and it's the kind of place where the street matters more than the tract.
And take tract 166 at 35.5, the one I know. It's going the wrong way: crime up 26% on last year, rent flat since 2019 at $760, 26% vacancy. Nothing in the data says it's turning. If it did, the first sign would be the crime count, because that's the segment that moves fastest.
The questions I'd ask about any red tract are the same ones I ask about a house. Is crime falling faster than the city's? Are owners moving in or out? Is the rent growing or stuck? Is the eviction ratio coming down? A tract that answers yes to two of those is a different proposition from one that answers no to all four, even at the same score. The other thing I'd ask is a property manager who already works that tract, because the data lags the street by a year and a good manager doesn't.
10. Where does this screen get it wrong?
Several places, and I'd rather you heard them from me.
A tract is still an average. The full report draws a quarter-mile circle around the house for crime and checks the block for distress, and both sit inside the tract. On the house I reported in tract 166, the quarter mile graded crime Level 1 while the tract grades Level 2, because the Prospect corridor is a fraction of the tract. A screen can't see that.
The rent and sales segments are proxies. The full report grades on live listings, sold comparables and HUD's small-area rents. The screen uses the census medians, which are five-year averages with wide margins at tract scale. Tract 52's $292 median rent and tract 53's $345,100 median value are both census figures, and both say more about who was surveyed than about what a house there would rent or sell for.
Schools are graded by district, so every Kansas City Public Schools tract carries the same 2. The full report looks at the nearest schools. Investment isn't graded at all; every tract carries a 3.
Thirty-one tracts were redrawn in 2020, so their 2019 figures come from the parent tract. Evictions cover Jackson County only, because that's where the data exists; the 42 Clay, Platte and Cass tracts carry a 3 on that segment with a note.
And here's the calibration, because a method that's never checked against anything is a story.
Tract
Full report
Screen
Same phase?
166, Wendell Phillips and Key Coalition
36.6
35.5
Yes, Phase 1
37, Washington Wheatley
41
39.3
Yes, Phase 1
77, North Town Fork Creek
58.5
52.7
Yes, Phase 2
105, Eastwood Hills East
59.1
61.2
Yes, Phase 2
106, Stayton Meadows
73.9
69.6
No. Screen says Phase 2, 0.4 under the line
Four of five within six points and on the right side of the phase line. The fifth, Stayton Meadows, is the one that matters, because it shows the screen's bias. The full report graded its schools and its rents on the ground and lifted it to Phase 3. The screen's district grade and census rent held it under. So read a screen score within five points of a phase line as "could be either", and read a Phase 1 score under 40 as what it looks like.
A full report on one house is slow work. This screen on 164 tracts tells you where that work is worth doing. The quarter-mile and block checks I run are in the foreign investor starter kit, if you want to run them yourself.
The bottom line
Kansas City doesn't have worst neighborhoods. It has 29 tracts out of 161 where the numbers run the wrong way, nearly all of them east of Troost and south of the river, and most of them sharing a name with a tract where the numbers run the right way. If you buy by the name, you'll pay a Phase 2 price for a Phase 1 street some of the time, and a Phase 1 price for a Phase 2 street the rest of the time, and you won't know which.
My rule is simple and it's boring. Phase 1, I don't buy, whatever the yield. Phase 2, I look at the house. Phase 3, I check whether the price still works. The tract tells me which of those three conversations to have. The street tells me whether to have it at all. Grading the street before the house is most of what my sourcing service is.
Remember, investing is a game of probabilities. A red tract on this map doesn't guarantee a bad outcome, and a green one doesn't guarantee a good one. What the map does is shift the odds, and shifting the odds is the whole job.
Free Investor Resources
The Foreign Investor Starter Kit
Everything you'll ever need to buy and manage U.S. rental property from overseas safely and with confidence.
Not as a city. KCPD reports were down 9.4% in the first ten and a half months of 2026 against the same period of 2025, and on my scorecard 109 of the city's 161 populated census tracts grade Level 4 or 5 on crime, which means falling or already low. The risk sits in specific tracts, most of them east of Troost Avenue and south of the river, where reports are rising against the city's trend. Those 29 tracts are the ones I grade Phase 1 and don't buy in. The grade is for the tract, not for any house.
Which Kansas City ZIP codes should I avoid for rental property?
I'd stop using ZIP codes for this. A Kansas City ZIP covers several census tracts, and on my November 2026 screen the tracts inside one ZIP often sit a full phase apart. The 29 Phase 1 tracts are all in Jackson County, south of the river, and 27 of them are east of Troost. Check the tract, then the quarter mile around the house, before the ZIP tells you anything.
What is a C class neighborhood in Kansas City?
In the A to D grades investors use, a C area is cheaper, older, more rental-heavy stock with a working tenant pool, and it covers most of the east side of Kansas City. I don't buy on the letter. I grade the tract on eleven segments and call it Phase 1, 2 or 3 by whether it's improving, and a C area can be any of the three. On my screen the median Kansas City tract scores 61, which is Phase 2, and that includes plenty of C stock.
Where do renters live in Kansas City?
Everywhere, but the share changes fast by tract. Citywide, 44.6% of occupied homes are rented. In the 29 Phase 1 tracts on my November 2026 screen, the renter share runs from 35% to 99%, and in the ten lowest tracts it's over 50% in eight of them. Tract 154.01 in Paseo West is 98.6% rented. A high renter share isn't bad on its own; it's bad when vacancy and evictions are high alongside it.
Can a Phase 1 tract become Phase 2?
Yes, and some are close. Tracts 132.03 in Ruskin Heights and 171 in Vineyard both sit within a point of 50 on my screen, and one improving segment would move either across. The segment that moves fastest is crime, because it's counted every year, and a tract whose reports fall faster than the city's picks up 15 weighting points in one step. Owner-occupancy and income move over years, not months, so a tract that needs those to change is a longer wait.
How is this different from the neighborhood ranking on the Kansas City hub?
The hub ranks the neighborhoods I'd buy in, from full reports on real houses. This page grades all 164 tracts in the city as a screen, from public data only, and its job is to show where the full reports haven't been run. Where both exist, they agree on the phase in four of five cases, and the screen sits within six points. The hub's scores are the ones to use for a house; this page's are the ones to use for a map.
Where does the data on this page come from, and can I check it?
All of it is public. Crime is every KCPD report with a location, from the city's open data portal at data.kcmo.org, 2022 to November 16, 2026. Income, rent, value, vacancy and tenure are the Census Bureau's 2020 to 2024 American Community Survey by tract. Jobs are the Census Bureau's LODES employment counts for 2023. Vouchers are HUD's Picture of Subsidized Households for 2025. Evictions are the Eviction Lab's Kansas City tracker, October 2025 to September 2026. The tract boundaries are the Census Bureau's 2020 tracts and the neighborhood borders are the city's own. The thresholds are printed in section 2 of this article, and every segment's level and trend for every tract is in the dataset behind the map.
Terms used in this article
Term
What it means
Census tract
A Census Bureau area of a few thousand people. Kansas City has 164 inside the city limits, 161 with residents
Phase 1, 2 and 3
My grades for an area: under 50 is Phase 1, where I don't buy; 50 to 69.9 is Phase 2, my target; 70 and up is Phase 3
Level and trend
Each segment is graded 1 to 5 on where it stands and plus or minus 1 on which way it's going
2026 pace
This year's count to November 16, scaled up by last year's full-year total over the same period, so 2026 can be compared with 2022
Low-crime floor
A tract under 180.6 police reports a square mile a year, the city's own rate, gets Level 5 on crime whatever its trend
Screen
The scorecard run on data that exists for every tract. A full report adds the quarter mile, the block and live listings for one house
Voucher tenancy
A rental where a tenant-based Housing Choice Voucher pays part of the rent
Eviction filing rate
Court filings in twelve months as a share of renter households, compared with Jackson County's 7.67%
Written by
David Garner
David is co-founder of Cashflow Rentals and a British investor who has personally purchased more than 120 U.S. rental properties as a foreign national since 2016. He helps overseas investors build U.S. rental portfolios remotely, from his base in Brazil.
This article is for information only and isn't financial, legal or tax advice. Cashflow Rentals is a consultancy, not a real estate broker, and charges an advisory fee for its sourcing service. The tract scores are a screen built from public data to November 16, 2026, grade areas and not houses, and will change as the data does. Your results on any property will differ.